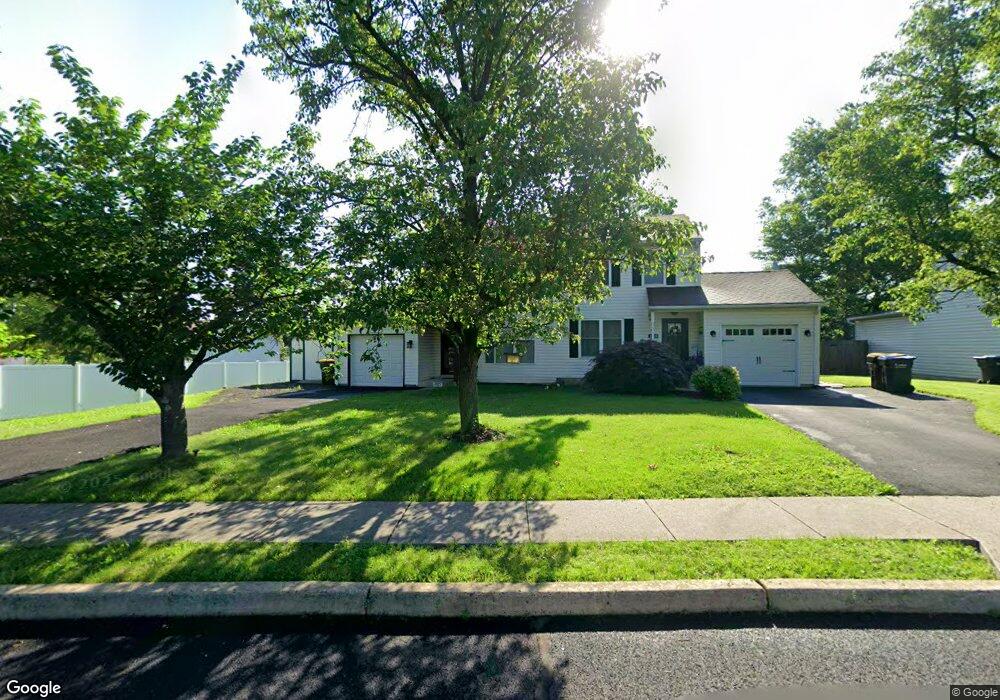
2115 Clover Mill Rd Quakertown, PA 18951
Milford-Quakertown NeighborhoodEstimated Value: $342,000 - $383,232
3
Beds
2
Baths
1,296
Sq Ft
$275/Sq Ft
Est. Value
About This Home
This home is located at 2115 Clover Mill Rd, Quakertown, PA 18951 and is currently estimated at $356,558, approximately $275 per square foot. 2115 Clover Mill Rd is a home located in Bucks County with nearby schools including Pfaff Elementary School, Quakertown Community Senior High School, and United Friends School.
Ownership History
Date
Name
Owned For
Owner Type
Purchase Details
Closed on
Nov 5, 2004
Sold by
Christian Scott R and Christian Dana B
Bought by
Jensen John D
Current Estimated Value
Home Financials for this Owner
Home Financials are based on the most recent Mortgage that was taken out on this home.
Original Mortgage
$195,000
Outstanding Balance
$92,522
Interest Rate
5.25%
Mortgage Type
Fannie Mae Freddie Mac
Estimated Equity
$264,036
Purchase Details
Closed on
May 31, 2002
Sold by
Schad Kirk E and Schad Stacey L
Bought by
Christian Scott R and Christian Dana B
Home Financials for this Owner
Home Financials are based on the most recent Mortgage that was taken out on this home.
Original Mortgage
$137,750
Interest Rate
6.9%
Purchase Details
Closed on
Aug 25, 1995
Sold by
Milford Investors Inc
Bought by
Schad Kirk E and Schad Stacey L
Home Financials for this Owner
Home Financials are based on the most recent Mortgage that was taken out on this home.
Original Mortgage
$112,650
Interest Rate
7.61%
Mortgage Type
FHA
Create a Home Valuation Report for This Property
The Home Valuation Report is an in-depth analysis detailing your home's value as well as a comparison with similar homes in the area
Home Values in the Area
Average Home Value in this Area
Purchase History
| Date | Buyer | Sale Price | Title Company |
|---|---|---|---|
| Jensen John D | $195,000 | Fidelity National Title Insu | |
| Christian Scott R | $145,000 | -- | |
| Schad Kirk E | $112,900 | -- |
Source: Public Records
Mortgage History
| Date | Status | Borrower | Loan Amount |
|---|---|---|---|
| Open | Jensen John D | $195,000 | |
| Previous Owner | Christian Scott R | $137,750 | |
| Previous Owner | Schad Kirk E | $112,650 |
Source: Public Records
Tax History Compared to Growth
Tax History
| Year | Tax Paid | Tax Assessment Tax Assessment Total Assessment is a certain percentage of the fair market value that is determined by local assessors to be the total taxable value of land and additions on the property. | Land | Improvement |
|---|---|---|---|---|
| 2025 | $3,880 | $19,240 | $2,840 | $16,400 |
| 2024 | $3,880 | $19,240 | $2,840 | $16,400 |
| 2023 | $3,841 | $19,240 | $2,840 | $16,400 |
| 2022 | $3,776 | $19,240 | $2,840 | $16,400 |
| 2021 | $3,776 | $19,240 | $2,840 | $16,400 |
| 2020 | $3,776 | $19,240 | $2,840 | $16,400 |
| 2019 | $3,672 | $19,240 | $2,840 | $16,400 |
| 2018 | $3,544 | $19,240 | $2,840 | $16,400 |
| 2017 | $3,435 | $19,240 | $2,840 | $16,400 |
| 2016 | $3,435 | $19,240 | $2,840 | $16,400 |
| 2015 | -- | $19,240 | $2,840 | $16,400 |
| 2014 | -- | $19,240 | $2,840 | $16,400 |
Source: Public Records
Map
Nearby Homes
- 1856 Alamingo Dr
- 1999 Crossing Way
- 1926 Alamingo Dr
- Manchester Plan at Fallbrooke Farms - Single Family Homes
- Arcadia Plan at Millstone at Parkside
- Covington Plan at Millstone at Parkside
- Harrison Plan at Millstone at Parkside
- Nottingham Plan at Fallbrooke Farms - Single Family Homes
- Parker Plan at Fallbrooke Farms - Single Family Homes
- Andrews Plan at Millstone at Parkside
- Nottingham Plan at Millstone at Parkside
- Arcadia Plan at Fallbrooke Farms - Single Family Homes
- Hawthorne Plan at Millstone at Parkside
- Augusta Plan at Fallbrooke Farms - Single Family Homes
- Lachlan Plan at Millstone at Parkside
- Covington Plan at Fallbrooke Farms - Single Family Homes
- Kipling Plan at Fallbrooke Farms - Single Family Homes
- Augusta Plan at Millstone at Parkside
- Kipling Plan at Millstone at Parkside
- Devonshire Plan at Millstone at Parkside
- 2113 Clover Mill Rd
- 2111 Clover Mill Rd
- 2155 Milford Square Pike
- 2109 Clover Mill Rd
- 2107 Clover Mill Rd
- 2090 Allentown Rd
- 2953 Clover Mill Rd
- 2105 Clover Mill Rd
- 2100 Allentown Rd
- 2100 Mill Valley Ln
- 2080 Allentown Rd
- 2140 Milford Square Pike
- 2110 Allentown Rd
- 2134 Milford Square Pike
- 2103 Clover Mill Rd
- 2150 Milford Square Pike
- 2144 Milford Square Pike
- 2102 Mill Valley Ln
- 2112 Allentown Rd
- 2104 Mill Valley Ln