Estimated Value: $252,000 - $278,000
3
Beds
2
Baths
1,190
Sq Ft
$224/Sq Ft
Est. Value
About This Home
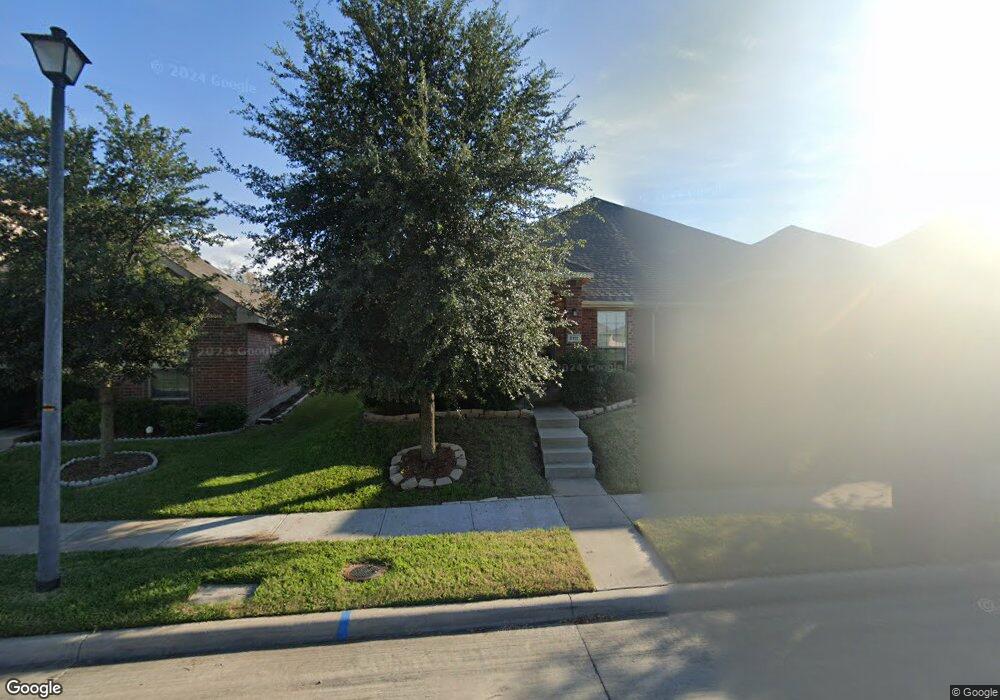
This home is located at 2115 Colby Ln, Wylie, TX 75098 and is currently estimated at $266,118, approximately $223 per square foot. 2115 Colby Ln is a home located in Collin County with nearby schools including George W Bush Elementary School, Frank Mcmillan Junior High School, and Davis Intermediate School.
Ownership History
Date
Name
Owned For
Owner Type
Purchase Details
Closed on
Apr 27, 2021
Sold by
Cox Kathryn Yvonne and Cox Kathryn Elaine
Bought by
Cox Kathryn Elaine
Current Estimated Value
Home Financials for this Owner
Home Financials are based on the most recent Mortgage that was taken out on this home.
Original Mortgage
$99,175
Outstanding Balance
$89,737
Interest Rate
3%
Mortgage Type
New Conventional
Estimated Equity
$176,381
Purchase Details
Closed on
Dec 22, 2016
Sold by
Ashmore Billy V
Bought by
Lotzer Kathryn Elaine and Cox Kathryn Vonne
Home Financials for this Owner
Home Financials are based on the most recent Mortgage that was taken out on this home.
Original Mortgage
$139,906
Interest Rate
4.5%
Mortgage Type
FHA
Purchase Details
Closed on
Nov 13, 2009
Sold by
D R Horton-Texas Ltd
Bought by
Ashmore Billy and Beane Sandra Lynn
Home Financials for this Owner
Home Financials are based on the most recent Mortgage that was taken out on this home.
Original Mortgage
$112,932
Interest Rate
4.93%
Create a Home Valuation Report for This Property
The Home Valuation Report is an in-depth analysis detailing your home's value as well as a comparison with similar homes in the area
Home Values in the Area
Average Home Value in this Area
Purchase History
| Date | Buyer | Sale Price | Title Company |
|---|---|---|---|
| Cox Kathryn Elaine | -- | None Available | |
| Lotzer Kathryn Elaine | -- | None Available | |
| Ashmore Billy | -- | None Available |
Source: Public Records
Mortgage History
| Date | Status | Borrower | Loan Amount |
|---|---|---|---|
| Open | Cox Kathryn Elaine | $99,175 | |
| Closed | Lotzer Kathryn Elaine | $139,906 | |
| Previous Owner | Ashmore Billy | $112,932 |
Source: Public Records
Tax History Compared to Growth
Tax History
| Year | Tax Paid | Tax Assessment Tax Assessment Total Assessment is a certain percentage of the fair market value that is determined by local assessors to be the total taxable value of land and additions on the property. | Land | Improvement |
|---|---|---|---|---|
| 2025 | $3,620 | $248,913 | $73,500 | $175,413 |
| 2024 | $3,620 | $247,649 | $68,250 | $187,558 |
| 2023 | $3,620 | $225,135 | $68,250 | $184,937 |
| 2022 | $4,490 | $204,668 | $36,750 | $185,027 |
| 2021 | $2,189 | $93,031 | $18,375 | $74,656 |
| 2020 | $2,232 | $89,883 | $18,375 | $71,508 |
| 2019 | $2,394 | $91,093 | $18,375 | $72,718 |
| 2018 | $2,254 | $83,678 | $18,375 | $65,303 |
| 2017 | $4,154 | $154,259 | $31,500 | $122,759 |
| 2016 | $3,694 | $132,948 | $31,500 | $101,448 |
| 2015 | $2,449 | $122,562 | $31,500 | $91,062 |
Source: Public Records
Map
Nearby Homes
- 2002 Trinity Ln
- 704 Ireland Way
- 702 Ireland Way
- 700 Ireland Way
- 702 Lynda Ln
- 2801-3 N State Highway 78
- 2801-1 N State Highway 78
- 2803 Skyview Dr
- 1312 Wyndham Dr
- Lot 1 @ Janet Dr
- 3060 Skyview Dr
- 112 Plainview Dr
- 2925 Janet Dr
- Lot 7 @ Trail Ridge Dr
- 2937 Crestridge Dr
- 132 Park Dr
- 1308 London Dr
- 2800 Gold Hill Dr
- 213 N West A Allen Blvd
- 205 Duck Blind Ave