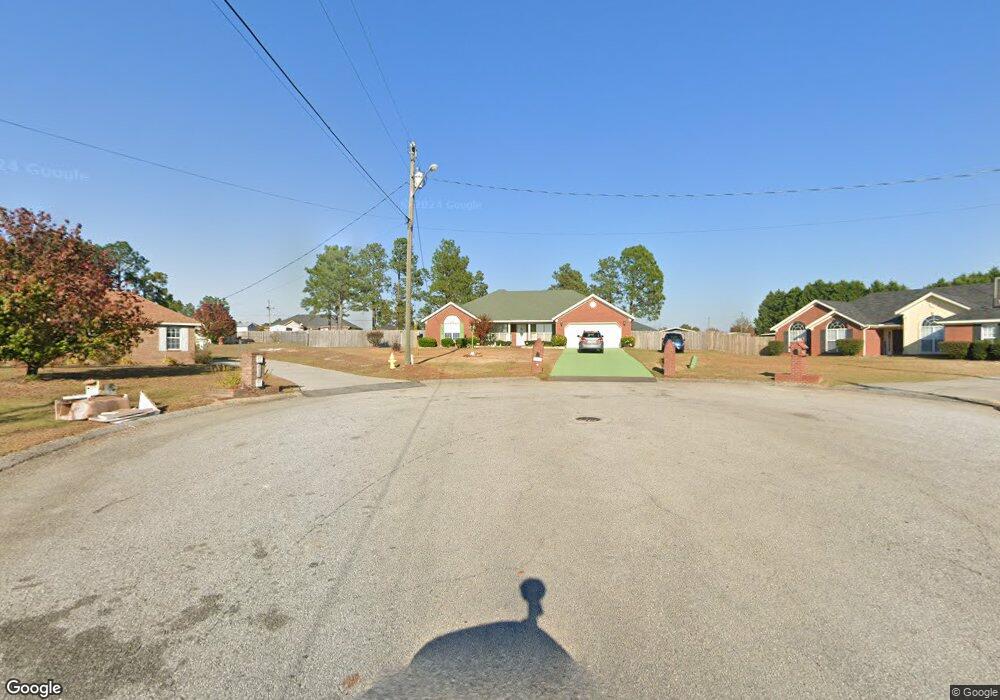
2115 Lisa Ln Hephzibah, GA 30815
Jamestown NeighborhoodEstimated Value: $295,607 - $340,000
4
Beds
2
Baths
2,119
Sq Ft
$148/Sq Ft
Est. Value
About This Home
This home is located at 2115 Lisa Ln, Hephzibah, GA 30815 and is currently estimated at $313,402, approximately $147 per square foot. 2115 Lisa Ln is a home located in Richmond County with nearby schools including Deer Chase Elementary School, Hephzibah Middle School, and Johnson Magnet.
Ownership History
Date
Name
Owned For
Owner Type
Purchase Details
Closed on
Mar 31, 2010
Sold by
Fontenot Darrell W
Bought by
Aaron Thomas E and Aaron Mary L
Current Estimated Value
Home Financials for this Owner
Home Financials are based on the most recent Mortgage that was taken out on this home.
Original Mortgage
$175,266
Outstanding Balance
$119,140
Interest Rate
5.5%
Mortgage Type
FHA
Estimated Equity
$194,262
Purchase Details
Closed on
Sep 17, 2003
Sold by
Kenneth Smith Homebuilders Inc
Bought by
Fontenot Darrell W and Fontenot Gwendolyn
Home Financials for this Owner
Home Financials are based on the most recent Mortgage that was taken out on this home.
Original Mortgage
$163,812
Interest Rate
6.24%
Mortgage Type
VA
Purchase Details
Closed on
Apr 10, 2003
Sold by
Southern Specialty Development Co Inc
Bought by
Kenneth Smith Homebuilders Inc
Home Financials for this Owner
Home Financials are based on the most recent Mortgage that was taken out on this home.
Original Mortgage
$120,750
Interest Rate
5.79%
Create a Home Valuation Report for This Property
The Home Valuation Report is an in-depth analysis detailing your home's value as well as a comparison with similar homes in the area
Home Values in the Area
Average Home Value in this Area
Purchase History
| Date | Buyer | Sale Price | Title Company |
|---|---|---|---|
| Aaron Thomas E | $178,500 | -- | |
| Fontenot Darrell W | $160,800 | -- | |
| Kenneth Smith Homebuilders Inc | $20,900 | -- |
Source: Public Records
Mortgage History
| Date | Status | Borrower | Loan Amount |
|---|---|---|---|
| Open | Aaron Thomas E | $175,266 | |
| Previous Owner | Fontenot Darrell W | $163,812 | |
| Previous Owner | Kenneth Smith Homebuilders Inc | $120,750 |
Source: Public Records
Tax History Compared to Growth
Tax History
| Year | Tax Paid | Tax Assessment Tax Assessment Total Assessment is a certain percentage of the fair market value that is determined by local assessors to be the total taxable value of land and additions on the property. | Land | Improvement |
|---|---|---|---|---|
| 2025 | $1,375 | $116,256 | $15,920 | $100,336 |
| 2024 | $1,375 | $112,944 | $15,920 | $97,024 |
| 2023 | $1,310 | $104,536 | $15,920 | $88,616 |
| 2022 | $1,202 | $82,892 | $15,920 | $66,972 |
| 2021 | $1,134 | $68,558 | $15,920 | $52,638 |
| 2020 | $1,141 | $68,558 | $15,920 | $52,638 |
| 2019 | $1,194 | $68,558 | $15,920 | $52,638 |
| 2018 | $1,200 | $68,558 | $15,920 | $52,638 |
| 2017 | $1,148 | $68,558 | $15,920 | $52,638 |
| 2016 | $1,149 | $68,558 | $15,920 | $52,638 |
| 2015 | $1,149 | $68,558 | $15,920 | $52,638 |
| 2014 | $2,588 | $68,558 | $15,920 | $52,638 |
Source: Public Records
Map
Nearby Homes
- 1914 Mitchell Place
- 2213 Riley Ct
- 1855 Beaver Creek Ln
- 2613 Inverness Dr
- 2682 Inverness Dr
- 2525 Hollington Dr
- 2686 Inverness Dr
- 4428 T J Kelly Dr
- 2690 Inverness Dr
- 2524 Hollington Dr
- 1764 Deer Chase Ln
- 2705 Inverness Dr
- 2520 Hollington Dr
- 2709 Inverness Dr
- 2505 Hollington Dr
- 2713 Inverness Dr
- 2698 Inverness Dr
- 2512 Hollington Dr
- 2394 Bellingham Dr
- 2721 Inverness Dr
- 2116 Lisa Ln
- 2113 Lisa Ln
- 1810 Beaver Creek Ln
- 1806 Beaver Creek Ln
- 1814 Beaver Creek Ln
- 2114 Lisa Ln
- 2111 Lisa Ln
- 1818 Beaver Creek Ln
- 2709 Spirit Creek Rd
- 2713 Spirit Creek Rd
- 2308 Kim Ct
- 2112 Lisa Ln
- 2717 Spirit Creek Rd
- 1802 Beaver Creek Ln
- 2109 Lisa Ln
- 2306 Kim Ct
- 1820 Beaver Creek Ln
- 2721 Spirit Creek Rd
- 1809 Beaver Creek Ln
- 1813 Beaver Creek Ln