Estimated Value: $175,000 - $205,000
3
Beds
1
Bath
1,484
Sq Ft
$129/Sq Ft
Est. Value
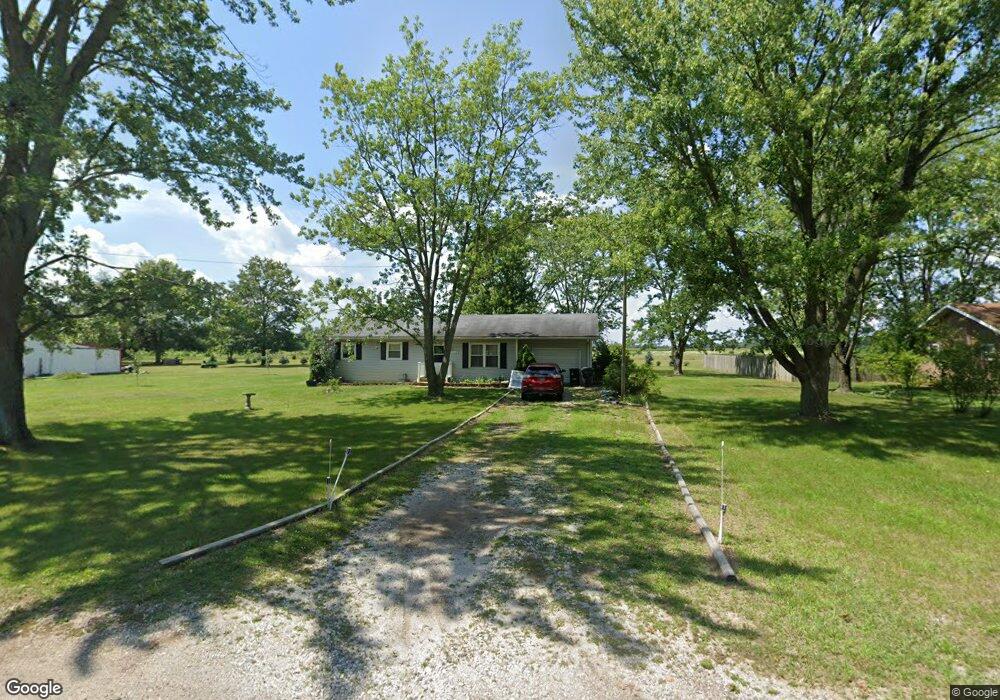
About This Home
This home is located at 2115 N 325 E, Knox, IN 46534 and is currently estimated at $191,602, approximately $129 per square foot. 2115 N 325 E is a home located in Starke County with nearby schools including Knox Community Elementary School, Knox Community Middle School, and Knox Community High School.
Ownership History
Date
Name
Owned For
Owner Type
Purchase Details
Closed on
Oct 3, 2025
Sold by
Hall Lawrence I
Bought by
Shelton John D and Shelton Terin R
Current Estimated Value
Home Financials for this Owner
Home Financials are based on the most recent Mortgage that was taken out on this home.
Original Mortgage
$176,000
Outstanding Balance
$176,000
Interest Rate
6.58%
Mortgage Type
New Conventional
Estimated Equity
$15,602
Purchase Details
Closed on
Mar 12, 2008
Sold by
Fowler Morris D and Fowler Charlene
Bought by
Hall Lawrence I
Home Financials for this Owner
Home Financials are based on the most recent Mortgage that was taken out on this home.
Original Mortgage
$50,000
Interest Rate
5.75%
Mortgage Type
New Conventional
Create a Home Valuation Report for This Property
The Home Valuation Report is an in-depth analysis detailing your home's value as well as a comparison with similar homes in the area
Purchase History
| Date | Buyer | Sale Price | Title Company |
|---|---|---|---|
| Shelton John D | -- | None Listed On Document | |
| Hall Lawrence I | -- | None Available |
Source: Public Records
Mortgage History
| Date | Status | Borrower | Loan Amount |
|---|---|---|---|
| Open | Shelton John D | $176,000 | |
| Previous Owner | Hall Lawrence I | $50,000 |
Source: Public Records
Tax History
| Year | Tax Paid | Tax Assessment Tax Assessment Total Assessment is a certain percentage of the fair market value that is determined by local assessors to be the total taxable value of land and additions on the property. | Land | Improvement |
|---|---|---|---|---|
| 2025 | $1,021 | $156,000 | $26,200 | $129,800 |
| 2024 | $1,021 | $146,600 | $25,000 | $121,600 |
| 2023 | $1,007 | $132,600 | $22,800 | $109,800 |
| 2022 | $744 | $118,300 | $21,000 | $97,300 |
| 2021 | $614 | $99,800 | $21,000 | $78,800 |
| 2020 | $864 | $92,700 | $21,000 | $71,700 |
| 2019 | $798 | $87,600 | $21,000 | $66,600 |
| 2018 | $672 | $87,000 | $21,900 | $65,100 |
| 2017 | $824 | $94,200 | $21,900 | $72,300 |
| 2016 | $843 | $93,200 | $21,900 | $71,300 |
| 2014 | $659 | $97,500 | $22,800 | $74,700 |
| 2013 | $630 | $97,000 | $22,800 | $74,200 |
Source: Public Records
Map
Nearby Homes
- 1615 N 300 E
- 4500 E 300 N
- 4170 E 250 N
- 100 N Portland St
- 207 W Lake St
- 203 W Lake St
- 551 E Mound St
- V/L E 100 N
- 2 N Pearl St
- 303 E Lake St
- 105 S Bower St
- 305 W New York St
- 302 S Main St
- 154 W New York St
- 1103 E Lake St
- 10300 E 150 N
- 4152 S State Road 35
- 156 W Street Louis St
- 1675 U S 35
- 601 S Heaton St
Your Personal Tour Guide
Ask me questions while you tour the home.