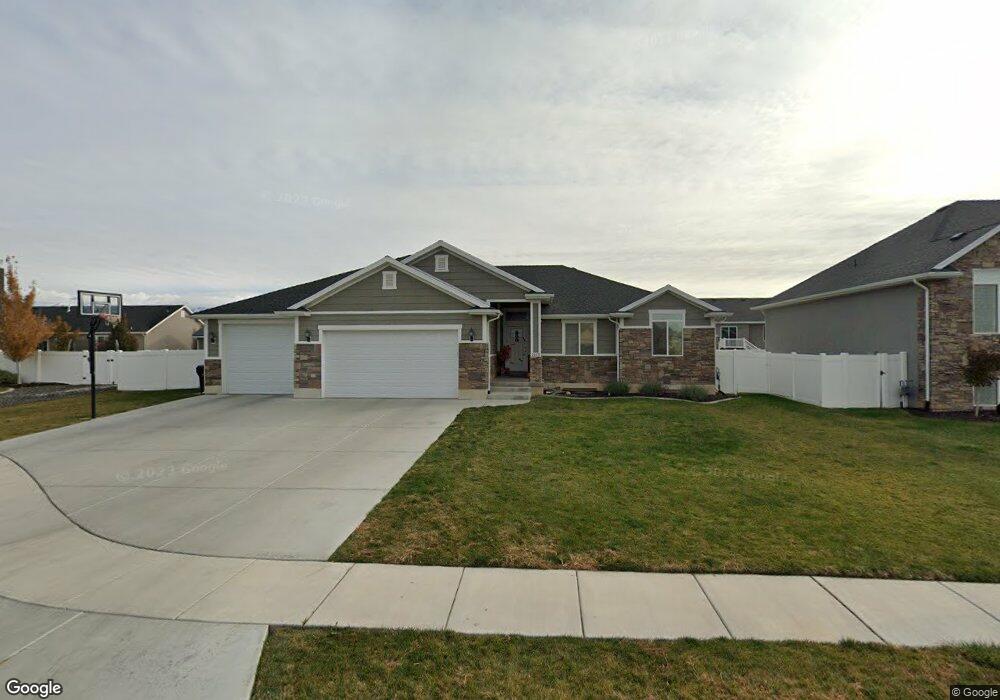
2115 S 1100 W Syracuse, UT 84075
Estimated Value: $637,000 - $699,000
4
Beds
2
Baths
3,110
Sq Ft
$214/Sq Ft
Est. Value
About This Home
This home is located at 2115 S 1100 W, Syracuse, UT 84075 and is currently estimated at $664,384, approximately $213 per square foot. 2115 S 1100 W is a home located in Davis County with nearby schools including Cook School, Legacy Junior High School, and Clearfield High School.
Ownership History
Date
Name
Owned For
Owner Type
Purchase Details
Closed on
Jul 22, 2022
Sold by
Dallas Lewis
Bought by
Sedgwick Dean and Sedgwick Devree
Current Estimated Value
Home Financials for this Owner
Home Financials are based on the most recent Mortgage that was taken out on this home.
Original Mortgage
$503,200
Outstanding Balance
$480,963
Interest Rate
5.81%
Mortgage Type
New Conventional
Estimated Equity
$183,421
Purchase Details
Closed on
Mar 18, 2022
Sold by
Aspire Homes and Ovation Homes Llc
Bought by
Middleton Jeff L
Home Financials for this Owner
Home Financials are based on the most recent Mortgage that was taken out on this home.
Original Mortgage
$467,052
Interest Rate
3.69%
Purchase Details
Closed on
Aug 19, 2019
Sold by
Metcalfe Jeffery H and Metcalfe Bridgette
Bought by
Lewis Dallas
Home Financials for this Owner
Home Financials are based on the most recent Mortgage that was taken out on this home.
Original Mortgage
$427,405
Interest Rate
3.7%
Mortgage Type
New Conventional
Create a Home Valuation Report for This Property
The Home Valuation Report is an in-depth analysis detailing your home's value as well as a comparison with similar homes in the area
Home Values in the Area
Average Home Value in this Area
Purchase History
| Date | Buyer | Sale Price | Title Company |
|---|---|---|---|
| Sedgwick Dean | -- | Us Title | |
| Middleton Jeff L | -- | Lincoln Title | |
| Middleton Jeff L | -- | Lincoln Title | |
| Lewis Dallas | -- | First American Title |
Source: Public Records
Mortgage History
| Date | Status | Borrower | Loan Amount |
|---|---|---|---|
| Open | Sedgwick Dean | $503,200 | |
| Previous Owner | Middleton Jeff L | $467,052 | |
| Previous Owner | Middleton Jeff L | $584,565 | |
| Previous Owner | Lewis Dallas | $427,405 |
Source: Public Records
Tax History Compared to Growth
Tax History
| Year | Tax Paid | Tax Assessment Tax Assessment Total Assessment is a certain percentage of the fair market value that is determined by local assessors to be the total taxable value of land and additions on the property. | Land | Improvement |
|---|---|---|---|---|
| 2025 | $3,455 | $333,300 | $123,707 | $209,593 |
| 2024 | $3,397 | $330,000 | $101,129 | $228,871 |
| 2023 | $3,187 | $564,000 | $140,978 | $423,022 |
| 2022 | $3,322 | $322,300 | $81,315 | $240,985 |
| 2021 | $2,949 | $443,000 | $120,031 | $322,969 |
| 2020 | $2,675 | $389,000 | $105,154 | $283,846 |
| 2019 | $2,577 | $370,000 | $102,057 | $267,943 |
| 2018 | $2,414 | $344,000 | $98,955 | $245,045 |
| 2016 | $2,262 | $169,015 | $38,008 | $131,007 |
| 2015 | $934 | $66,501 | $38,008 | $28,493 |
Source: Public Records
Map
Nearby Homes