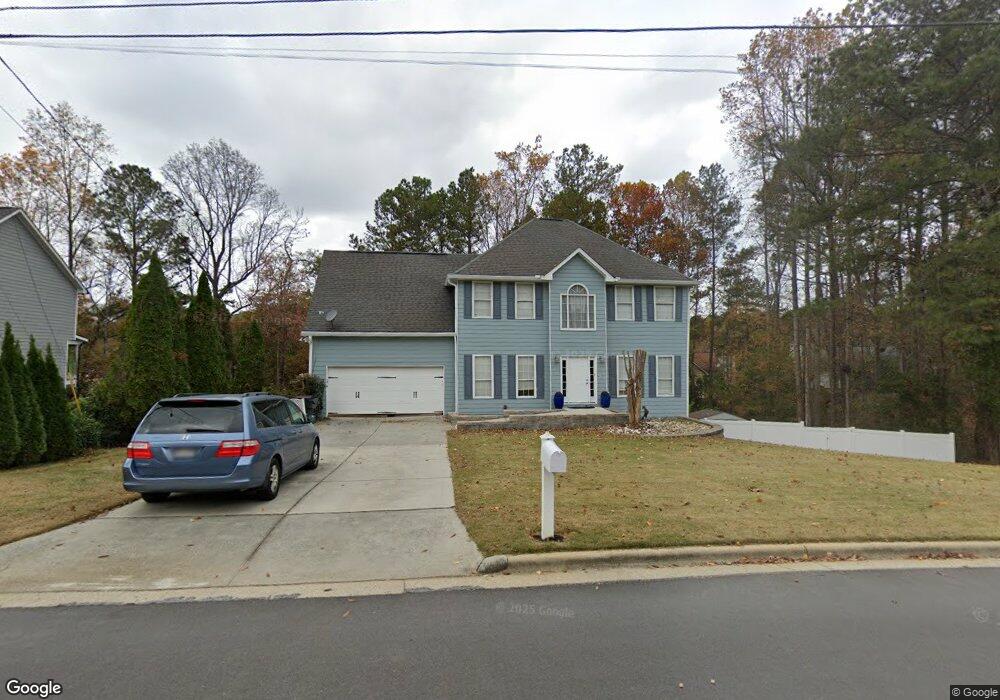
2115 Springer Walk Unit 2 Lawrenceville, GA 30043
Estimated Value: $429,000 - $513,000
4
Beds
3
Baths
2,352
Sq Ft
$198/Sq Ft
Est. Value
About This Home
This home is located at 2115 Springer Walk Unit 2, Lawrenceville, GA 30043 and is currently estimated at $466,702, approximately $198 per square foot. 2115 Springer Walk Unit 2 is a home located in Gwinnett County with nearby schools including Jackson Elementary School, Northbrook Middle School, and Peachtree Ridge High School.
Ownership History
Date
Name
Owned For
Owner Type
Purchase Details
Closed on
Sep 27, 2000
Sold by
Smith Brandt L and Smith Laurie
Bought by
Veazey Andrew M and Veazey Susan K
Current Estimated Value
Home Financials for this Owner
Home Financials are based on the most recent Mortgage that was taken out on this home.
Original Mortgage
$133,600
Outstanding Balance
$47,381
Interest Rate
7.91%
Mortgage Type
New Conventional
Estimated Equity
$419,321
Purchase Details
Closed on
Jun 25, 1999
Sold by
Amlani Bashir and Amlani Naseem
Bought by
Smith Brandt L and Smith Laurie
Home Financials for this Owner
Home Financials are based on the most recent Mortgage that was taken out on this home.
Original Mortgage
$161,650
Interest Rate
6.86%
Mortgage Type
VA
Purchase Details
Closed on
Aug 1, 1995
Sold by
Bowen Bowen Const Co
Bought by
Amlani Bashir Naseem
Create a Home Valuation Report for This Property
The Home Valuation Report is an in-depth analysis detailing your home's value as well as a comparison with similar homes in the area
Home Values in the Area
Average Home Value in this Area
Purchase History
| Date | Buyer | Sale Price | Title Company |
|---|---|---|---|
| Veazey Andrew M | $167,000 | -- | |
| Smith Brandt L | $158,500 | -- | |
| Amlani Bashir Naseem | $135,300 | -- |
Source: Public Records
Mortgage History
| Date | Status | Borrower | Loan Amount |
|---|---|---|---|
| Open | Veazey Andrew M | $133,600 | |
| Previous Owner | Smith Brandt L | $161,650 | |
| Closed | Amlani Bashir Naseem | $0 |
Source: Public Records
Tax History Compared to Growth
Tax History
| Year | Tax Paid | Tax Assessment Tax Assessment Total Assessment is a certain percentage of the fair market value that is determined by local assessors to be the total taxable value of land and additions on the property. | Land | Improvement |
|---|---|---|---|---|
| 2025 | $4,779 | $188,280 | $28,400 | $159,880 |
| 2024 | $4,925 | $188,280 | $28,400 | $159,880 |
| 2023 | $4,925 | $194,120 | $28,400 | $165,720 |
| 2022 | $3,356 | $113,840 | $20,000 | $93,840 |
| 2021 | $3,412 | $113,840 | $20,000 | $93,840 |
| 2020 | $3,437 | $123,360 | $20,000 | $103,360 |
| 2019 | $2,933 | $94,000 | $23,200 | $70,800 |
| 2018 | $2,935 | $94,000 | $23,200 | $70,800 |
| 2016 | $2,919 | $92,080 | $20,000 | $72,080 |
| 2015 | $2,412 | $67,920 | $13,600 | $54,320 |
| 2014 | $2,423 | $67,920 | $13,600 | $54,320 |
Source: Public Records
Map
Nearby Homes
- 955 Pointers Way
- 2117 Whitfield Ln
- 804 Bankshire Dr
- 2210 Ashley Crossing Ct Unit 2
- 1974 Hunt Crossing Ct Unit 1
- 868 Ashley Crossing Ln
- 1955 Suwanee Valley Rd Unit 1
- 1015 Rowe Oak Cir
- 741 Saddle Wood Way
- 2021 Huntcliff Dr Unit 1
- 1021 Slash Pine Ct
- 730 Tab Roberts Rd
- 916 Tab Roberts Rd
- 2105 Tropicana Dr
- 727 Eight Point Ct
- 2071 Morning Brook Cir Unit 3
- 1883 Suwanee Terrace NW
- 1830 McKendree Lake Dr
- 1420 Midland Way
- 1883 Suwanee Terrace
- 2125 Springer Walk
- 2105 Springer Walk
- 894 Pointers Way
- 0 Springer Walk Unit 8786332
- 0 Springer Walk Unit 8695360
- 0 Springer Walk Unit 3159953
- 0 Springer Walk Unit 8727393
- 0 Springer Walk
- 864 Pointers Way Unit 2
- 864 Pointers Way
- 864 Pointers Way
- 874 Pointers Way Unit 2
- 904 Pointers Way Unit 2
- 2100 Springer Walk
- 2120 Springer Walk Unit 2
- 2135 Springer Walk Unit 2
- 854 Pointers Way
- 2130 Springer Walk
- 2080 Springer Walk Unit 2
- 914 Pointers Way