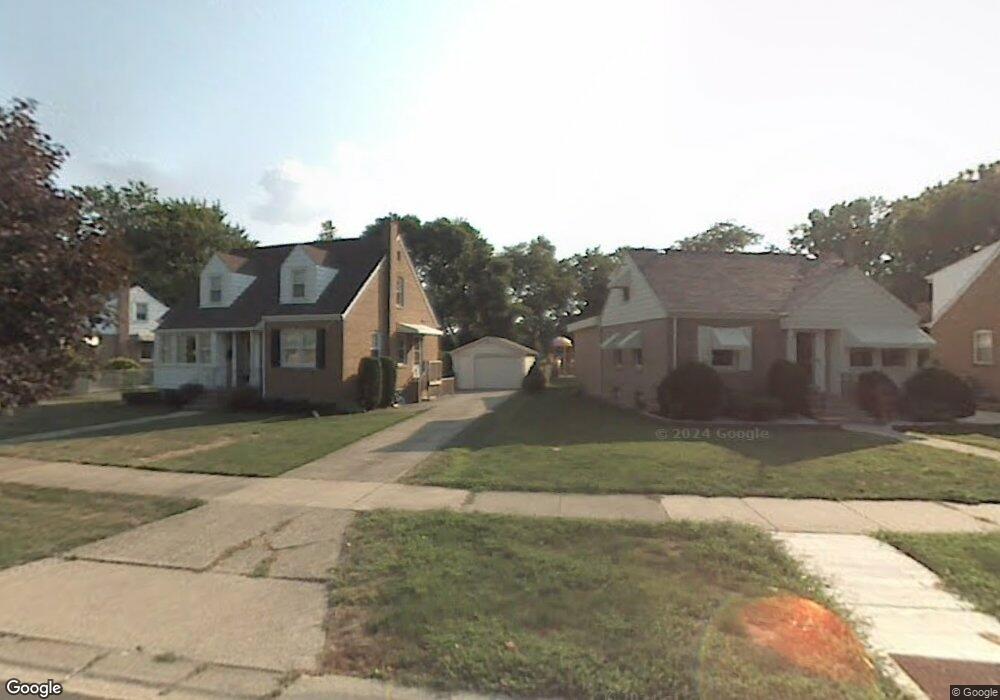
21150 Maple St Matteson, IL 60443
Old Matteson NeighborhoodEstimated Value: $198,000 - $212,000
3
Beds
2
Baths
1,232
Sq Ft
$167/Sq Ft
Est. Value
About This Home
This home is located at 21150 Maple St, Matteson, IL 60443 and is currently estimated at $205,325, approximately $166 per square foot. 21150 Maple St is a home located in Cook County with nearby schools including Illinois School, Matteson Elementary School, and Sauk Elementary School.
Ownership History
Date
Name
Owned For
Owner Type
Purchase Details
Closed on
Jul 26, 2007
Sold by
Quest Capital Mgt Inc
Bought by
Watts Shawn
Current Estimated Value
Home Financials for this Owner
Home Financials are based on the most recent Mortgage that was taken out on this home.
Original Mortgage
$192,000
Outstanding Balance
$121,751
Interest Rate
6.69%
Mortgage Type
Unknown
Estimated Equity
$83,574
Purchase Details
Closed on
Feb 27, 2004
Sold by
Nitz Eva P
Bought by
Schnittker Jamie L
Home Financials for this Owner
Home Financials are based on the most recent Mortgage that was taken out on this home.
Original Mortgage
$127,950
Interest Rate
6.37%
Mortgage Type
Unknown
Purchase Details
Closed on
Oct 21, 1993
Sold by
Lyne Eva P and Nitz Eva P
Bought by
Nitz Chester M and Nitz Eva P
Create a Home Valuation Report for This Property
The Home Valuation Report is an in-depth analysis detailing your home's value as well as a comparison with similar homes in the area
Home Values in the Area
Average Home Value in this Area
Purchase History
| Date | Buyer | Sale Price | Title Company |
|---|---|---|---|
| Watts Shawn | $192,000 | Ctic | |
| Quest Capital Management Inc | $179,000 | Cti | |
| Schnittker Jamie L | $135,000 | Pntn | |
| Nitz Chester M | -- | -- |
Source: Public Records
Mortgage History
| Date | Status | Borrower | Loan Amount |
|---|---|---|---|
| Open | Watts Shawn | $192,000 | |
| Previous Owner | Schnittker Jamie L | $127,950 |
Source: Public Records
Tax History Compared to Growth
Tax History
| Year | Tax Paid | Tax Assessment Tax Assessment Total Assessment is a certain percentage of the fair market value that is determined by local assessors to be the total taxable value of land and additions on the property. | Land | Improvement |
|---|---|---|---|---|
| 2024 | $5,656 | $14,132 | $2,650 | $11,482 |
| 2023 | $2,366 | $17,000 | $2,650 | $14,350 |
| 2022 | $2,366 | $7,783 | $2,319 | $5,464 |
| 2021 | $2,448 | $7,781 | $2,318 | $5,463 |
| 2020 | $2,383 | $7,781 | $2,318 | $5,463 |
| 2019 | $2,604 | $8,461 | $2,153 | $6,308 |
| 2018 | $2,601 | $8,461 | $2,153 | $6,308 |
| 2017 | $2,925 | $9,262 | $2,153 | $7,109 |
| 2016 | $2,330 | $7,235 | $1,987 | $5,248 |
| 2015 | $2,248 | $7,235 | $1,987 | $5,248 |
| 2014 | $2,204 | $7,235 | $1,987 | $5,248 |
| 2013 | $3,243 | $10,144 | $1,987 | $8,157 |
Source: Public Records
Map
Nearby Homes
- 21142 Locust St
- 3718 211th Place
- 21209 Oak St
- 3712 214th St
- 3919 214th St
- 3727 214th Place Unit 2
- 3704 215th St Unit 205
- 549 Homan Ave
- 3809 215th St
- 20852 Greenwood Dr
- 820 Exmoor Rd
- 3762 216th Place
- 305 Jackson St
- 410 Gettysburg St
- 21607 Main St
- 3865 216th St
- 831 Violet Ln
- 508 Davis St
- 3817 216th Place
- 120 Indiana St