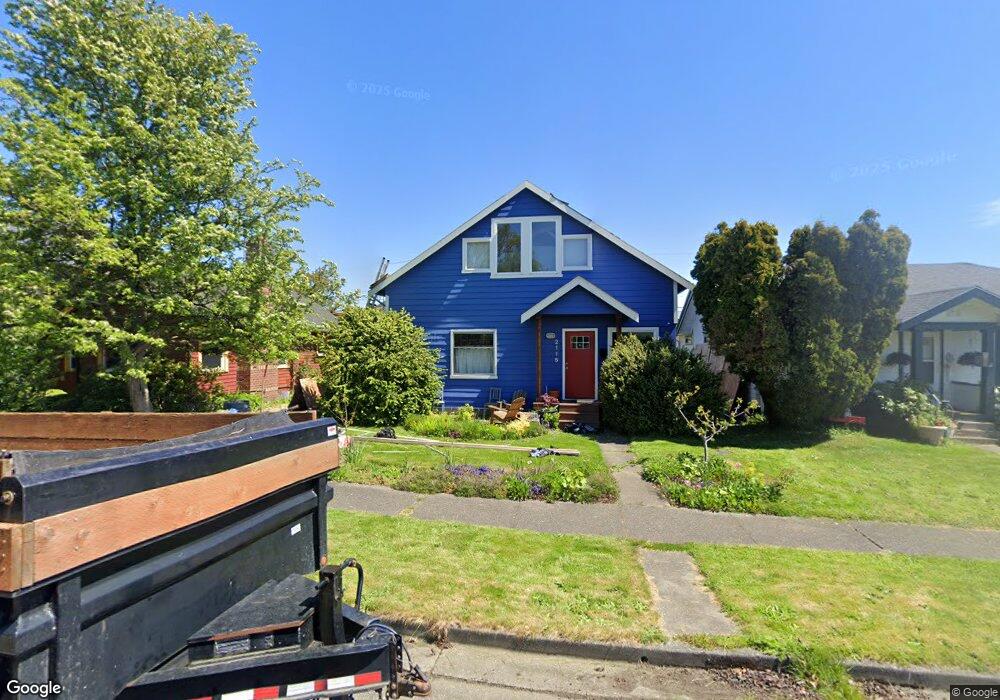
2116 Franklin St Bellingham, WA 98225
Sunnyland NeighborhoodEstimated Value: $552,000 - $608,303
2
Beds
2
Baths
1,309
Sq Ft
$451/Sq Ft
Est. Value
About This Home
This home is located at 2116 Franklin St, Bellingham, WA 98225 and is currently estimated at $590,326, approximately $450 per square foot. 2116 Franklin St is a home located in Whatcom County with nearby schools including Sunnyland Elementary School, Whatcom Middle School, and Bellingham High School.
Ownership History
Date
Name
Owned For
Owner Type
Purchase Details
Closed on
Aug 10, 2007
Sold by
Fryer Christopher S and Fryer Jennifer L
Bought by
Ring Calhan D and Ferrier Hart Elizabeth A
Current Estimated Value
Home Financials for this Owner
Home Financials are based on the most recent Mortgage that was taken out on this home.
Original Mortgage
$159,000
Outstanding Balance
$100,465
Interest Rate
6.62%
Mortgage Type
Unknown
Estimated Equity
$489,861
Purchase Details
Closed on
Feb 9, 2000
Sold by
Moore Gilbert and Moore Judith
Bought by
Brooks Jennifer L and Fryer Christopher S
Home Financials for this Owner
Home Financials are based on the most recent Mortgage that was taken out on this home.
Original Mortgage
$81,800
Interest Rate
8.06%
Mortgage Type
FHA
Create a Home Valuation Report for This Property
The Home Valuation Report is an in-depth analysis detailing your home's value as well as a comparison with similar homes in the area
Home Values in the Area
Average Home Value in this Area
Purchase History
| Date | Buyer | Sale Price | Title Company |
|---|---|---|---|
| Ring Calhan D | $212,280 | Whatcom Land Title | |
| Brooks Jennifer L | $82,500 | Whatcom Land Title Company I |
Source: Public Records
Mortgage History
| Date | Status | Borrower | Loan Amount |
|---|---|---|---|
| Open | Ring Calhan D | $159,000 | |
| Previous Owner | Brooks Jennifer L | $81,800 |
Source: Public Records
Tax History Compared to Growth
Tax History
| Year | Tax Paid | Tax Assessment Tax Assessment Total Assessment is a certain percentage of the fair market value that is determined by local assessors to be the total taxable value of land and additions on the property. | Land | Improvement |
|---|---|---|---|---|
| 2024 | $4,088 | $512,080 | $246,304 | $265,776 |
| 2023 | $4,088 | $525,086 | $252,560 | $272,526 |
| 2022 | $3,337 | $452,669 | $217,728 | $234,941 |
| 2021 | $3,274 | $359,261 | $172,800 | $186,461 |
| 2020 | $3,276 | $332,649 | $160,000 | $172,649 |
| 2019 | $2,933 | $321,723 | $141,415 | $180,308 |
| 2018 | $2,953 | $288,797 | $126,965 | $161,832 |
| 2017 | $2,546 | $248,644 | $109,310 | $139,334 |
| 2016 | $2,229 | $224,056 | $98,090 | $125,966 |
| 2015 | $2,185 | $204,144 | $89,590 | $114,554 |
| 2014 | -- | $193,685 | $85,000 | $108,685 |
| 2013 | -- | $192,104 | $78,750 | $113,354 |
Source: Public Records
Map
Nearby Homes
- 2120 Franklin St
- 2114 Franklin St
- 2108 Franklin St
- 2128 Franklin St
- 2130 Franklin St
- 409 Kentucky St
- 401 Kentucky St
- 2132 Franklin St
- 2138 Franklin St
- 2115 Franklin St
- 2123 Franklin St
- 2127 Franklin St
- 317 Kentucky St
- 317 Kentucky St
- 2131 Franklin St
- 315 Kentucky St
- 2139 Franklin St
- 407 Virginia St
- 2202 Franklin St
- 2110 Grant St