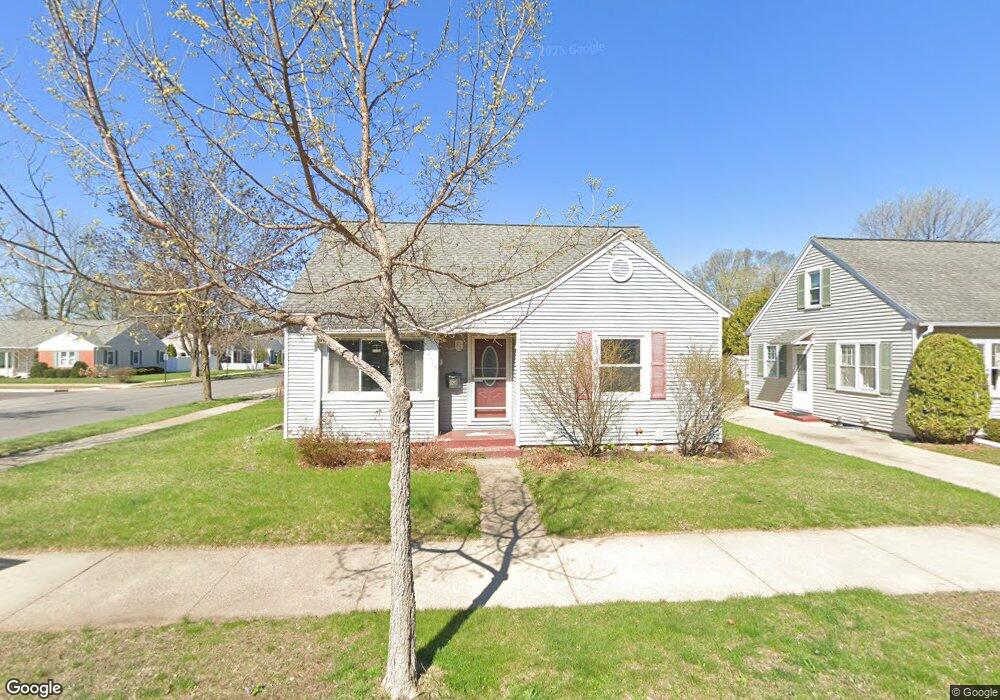
2116 Lamont St Wausau, WI 54403
Southeast Side NeighborhoodEstimated Value: $215,738 - $232,000
3
Beds
1
Bath
--
Sq Ft
5,663
Sq Ft Lot
About This Home
This home is located at 2116 Lamont St, Wausau, WI 54403 and is currently estimated at $222,935. 2116 Lamont St is a home located in Marathon County with nearby schools including John Marshall Elementary School, Horace Mann Middle School, and East High School.
Ownership History
Date
Name
Owned For
Owner Type
Purchase Details
Closed on
May 25, 2018
Sold by
Lesage Joy L
Bought by
Lesage Caleb T
Current Estimated Value
Home Financials for this Owner
Home Financials are based on the most recent Mortgage that was taken out on this home.
Original Mortgage
$99,800
Outstanding Balance
$72,541
Interest Rate
4.25%
Mortgage Type
Adjustable Rate Mortgage/ARM
Estimated Equity
$150,394
Purchase Details
Closed on
Nov 15, 2006
Sold by
Hud
Bought by
Lesage Joy L
Home Financials for this Owner
Home Financials are based on the most recent Mortgage that was taken out on this home.
Original Mortgage
$62,400
Interest Rate
6.41%
Mortgage Type
Unknown
Purchase Details
Closed on
Jun 7, 2006
Sold by
Citimortgage Inc
Bought by
Hud
Purchase Details
Closed on
Apr 28, 2006
Sold by
Knaebe Glenn G
Bought by
Citimortgage Inc
Create a Home Valuation Report for This Property
The Home Valuation Report is an in-depth analysis detailing your home's value as well as a comparison with similar homes in the area
Home Values in the Area
Average Home Value in this Area
Purchase History
| Date | Buyer | Sale Price | Title Company |
|---|---|---|---|
| Lesage Caleb T | $103,000 | None Available | |
| Lesage Joy L | -- | None Available | |
| Hud | $103,300 | None Available | |
| Citimortgage Inc | -- | None Available |
Source: Public Records
Mortgage History
| Date | Status | Borrower | Loan Amount |
|---|---|---|---|
| Open | Lesage Caleb T | $99,800 | |
| Previous Owner | Lesage Joy L | $62,400 |
Source: Public Records
Tax History Compared to Growth
Tax History
| Year | Tax Paid | Tax Assessment Tax Assessment Total Assessment is a certain percentage of the fair market value that is determined by local assessors to be the total taxable value of land and additions on the property. | Land | Improvement |
|---|---|---|---|---|
| 2024 | $3,184 | $164,900 | $27,500 | $137,400 |
| 2023 | $2,504 | $112,300 | $25,100 | $87,200 |
| 2022 | $2,537 | $112,300 | $25,100 | $87,200 |
| 2021 | $2,435 | $112,300 | $25,100 | $87,200 |
| 2020 | $2,570 | $112,300 | $25,100 | $87,200 |
| 2019 | $2,575 | $106,300 | $21,300 | $85,000 |
| 2018 | $2,748 | $106,300 | $21,300 | $85,000 |
| 2017 | $2,518 | $106,300 | $21,300 | $85,000 |
| 2016 | $2,696 | $106,300 | $21,300 | $85,000 |
| 2015 | $2,644 | $106,300 | $21,300 | $85,000 |
| 2014 | $2,627 | $110,900 | $22,100 | $88,800 |
Source: Public Records
Map
Nearby Homes