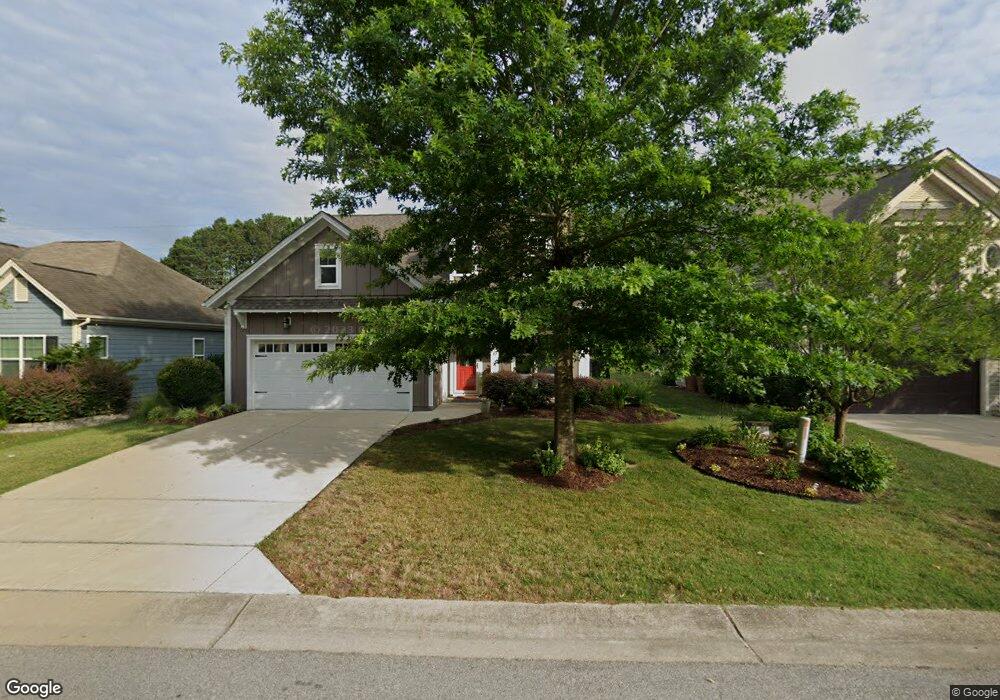
2116 Longmont Dr Unit LOT91 Wake Forest, NC 27587
Estimated Value: $396,000 - $436,000
3
Beds
3
Baths
1,887
Sq Ft
$220/Sq Ft
Est. Value
About This Home
This home is located at 2116 Longmont Dr Unit LOT91, Wake Forest, NC 27587 and is currently estimated at $415,716, approximately $220 per square foot. 2116 Longmont Dr Unit LOT91 is a home located in Wake County with nearby schools including Sanford Creek Elementary School, Wake Forest-Rolesville Middle School, and Wake Forest High School.
Ownership History
Date
Name
Owned For
Owner Type
Purchase Details
Closed on
Jan 16, 2025
Sold by
Vilga Danielle L and Vilga Paul A
Bought by
Cavalet Virginia L
Current Estimated Value
Purchase Details
Closed on
Apr 14, 2021
Sold by
Graham Virginia Lois
Bought by
Graham Virginia Lois and Cavalet Virgina L
Purchase Details
Closed on
Jan 23, 2012
Sold by
Homes By Dickerson Inc
Bought by
Wortham Mark and Martin Lori M
Home Financials for this Owner
Home Financials are based on the most recent Mortgage that was taken out on this home.
Original Mortgage
$186,350
Interest Rate
4.75%
Mortgage Type
New Conventional
Purchase Details
Closed on
Aug 4, 2010
Sold by
Villages Of Austin Creek Llc
Bought by
Homes By Dickerson Inc
Home Financials for this Owner
Home Financials are based on the most recent Mortgage that was taken out on this home.
Original Mortgage
$172,500
Interest Rate
4.7%
Mortgage Type
Construction
Create a Home Valuation Report for This Property
The Home Valuation Report is an in-depth analysis detailing your home's value as well as a comparison with similar homes in the area
Home Values in the Area
Average Home Value in this Area
Purchase History
| Date | Buyer | Sale Price | Title Company |
|---|---|---|---|
| Cavalet Virginia L | -- | None Listed On Document | |
| Cavalet Virginia L | -- | None Listed On Document | |
| Graham Virginia Lois | -- | None Available | |
| Wortham Mark | $186,500 | None Available | |
| Homes By Dickerson Inc | $90,000 | None Available |
Source: Public Records
Mortgage History
| Date | Status | Borrower | Loan Amount |
|---|---|---|---|
| Previous Owner | Wortham Mark | $186,350 | |
| Previous Owner | Homes By Dickerson Inc | $172,500 |
Source: Public Records
Tax History Compared to Growth
Tax History
| Year | Tax Paid | Tax Assessment Tax Assessment Total Assessment is a certain percentage of the fair market value that is determined by local assessors to be the total taxable value of land and additions on the property. | Land | Improvement |
|---|---|---|---|---|
| 2025 | $2,017 | $400,406 | $80,000 | $320,406 |
| 2024 | $2,010 | $400,406 | $80,000 | $320,406 |
| 2023 | $1,633 | $277,635 | $40,000 | $237,635 |
| 2022 | $1,567 | $277,635 | $40,000 | $237,635 |
| 2021 | $2,300 | $277,635 | $40,000 | $237,635 |
| 2020 | $3,060 | $277,635 | $40,000 | $237,635 |
| 2019 | $2,692 | $215,339 | $35,250 | $180,089 |
| 2018 | $2,549 | $215,339 | $35,250 | $180,089 |
| 2017 | $2,464 | $215,339 | $35,250 | $180,089 |
| 2016 | $2,433 | $215,339 | $35,250 | $180,089 |
| 2015 | $2,293 | $200,341 | $36,000 | $164,341 |
| 2014 | $2,220 | $200,341 | $36,000 | $164,341 |
Source: Public Records
Map
Nearby Homes
- 2009 Birdhouse Ln
- 1904 Austin Ridge Pkwy
- 417 Austin View Blvd
- 520 Austin View Blvd
- 2236 Longmont Dr
- 1301 Rose Finch Cir
- 1816 Birdhouse Ln
- 1704 Fawn Chase Ct
- 1824 Longmont Dr
- 321 Kavanaugh Rd
- 276 Kavanaugh Rd
- HORIZON Plan at Meadow at Jones Dairy
- SHILO Plan at Meadow at Jones Dairy
- ALTON Plan at Meadow at Jones Dairy
- EPIPHANY Plan at Meadow at Jones Dairy
- AURORA Plan at Meadow at Jones Dairy
- MEADOW Plan at Meadow at Jones Dairy
- HAVEN II Plan at Meadow at Jones Dairy
- AUTUMN Plan at Meadow at Jones Dairy
- GRACE Plan at Meadow at Jones Dairy
- 2116 Longmont Dr
- 2112 Longmont Dr
- 2124 Longmont Dr
- 2108 Longmont Dr
- 2117 Longmont Dr
- 2121 Longmont Dr
- 2104 Longmont Dr
- 2128 Longmont Dr
- 2113 Longmont Dr
- 2125 Longmont Dr
- 2109 Longmont Dr
- 2129 Longmont Dr
- 2100 Longmont Dr
- 2132 Longmont Dr
- 2105 Longmont Dr
- 2133 Longmont Dr
- 1965 Austin Ridge Pkwy
- 2101 Longmont Dr
- 1976 Austin Ridge Pkwy Unit 347
- 1976 Austin Ridge Pkwy