2116 Tanglewood Blvd Unit 206 Pottsboro, TX 75076
Estimated Value: $130,087 - $169,000
2
Beds
2
Baths
708
Sq Ft
$211/Sq Ft
Est. Value
About This Home
This home is located at 2116 Tanglewood Blvd Unit 206, Pottsboro, TX 75076 and is currently estimated at $149,544, approximately $211 per square foot. 2116 Tanglewood Blvd Unit 206 is a home located in Grayson County with nearby schools including Pottsboro Elementary School, Pottsboro Middle School, and Pottsboro High School.
Ownership History
Date
Name
Owned For
Owner Type
Purchase Details
Closed on
Jul 27, 2012
Sold by
The Secretary Of Hud
Bought by
Roelke Thomas M
Current Estimated Value
Purchase Details
Closed on
Apr 27, 2012
Sold by
Bank Of America Na
Bought by
The Secretary Of Housing & Urban Develop
Purchase Details
Closed on
Feb 7, 2012
Sold by
Bertrand Brandon L and Bertrand Michael L
Bought by
Bank Of America Na
Purchase Details
Closed on
Mar 10, 2004
Sold by
Jones Lacey N
Bought by
Bertrand Brandon L and Bertrand Michael L
Home Financials for this Owner
Home Financials are based on the most recent Mortgage that was taken out on this home.
Original Mortgage
$59,627
Interest Rate
5.68%
Mortgage Type
FHA
Create a Home Valuation Report for This Property
The Home Valuation Report is an in-depth analysis detailing your home's value as well as a comparison with similar homes in the area
Home Values in the Area
Average Home Value in this Area
Purchase History
| Date | Buyer | Sale Price | Title Company |
|---|---|---|---|
| Roelke Thomas M | -- | None Available | |
| The Secretary Of Housing & Urban Develop | -- | None Available | |
| Bank Of America Na | $57,665 | None Available | |
| Bertrand Brandon L | -- | -- |
Source: Public Records
Mortgage History
| Date | Status | Borrower | Loan Amount |
|---|---|---|---|
| Previous Owner | Bertrand Brandon L | $59,627 |
Source: Public Records
Tax History Compared to Growth
Tax History
| Year | Tax Paid | Tax Assessment Tax Assessment Total Assessment is a certain percentage of the fair market value that is determined by local assessors to be the total taxable value of land and additions on the property. | Land | Improvement |
|---|---|---|---|---|
| 2025 | $322 | $95,866 | -- | -- |
| 2024 | $1,207 | $87,151 | $0 | $0 |
| 2023 | $286 | $79,228 | $0 | $0 |
| 2022 | $636 | $72,025 | $0 | $0 |
| 2021 | $1,065 | $65,477 | $1,250 | $64,227 |
| 2020 | $1,110 | $65,731 | $1,250 | $64,481 |
| 2019 | $1,174 | $66,380 | $1,250 | $65,130 |
| 2018 | $1,129 | $63,035 | $1,250 | $61,785 |
| 2017 | $1,062 | $58,519 | $1,250 | $57,269 |
| 2016 | $1,066 | $58,732 | $1,250 | $57,482 |
| 2015 | $0 | $57,573 | $950 | $56,623 |
| 2014 | -- | $47,657 | $787 | $46,870 |
Source: Public Records
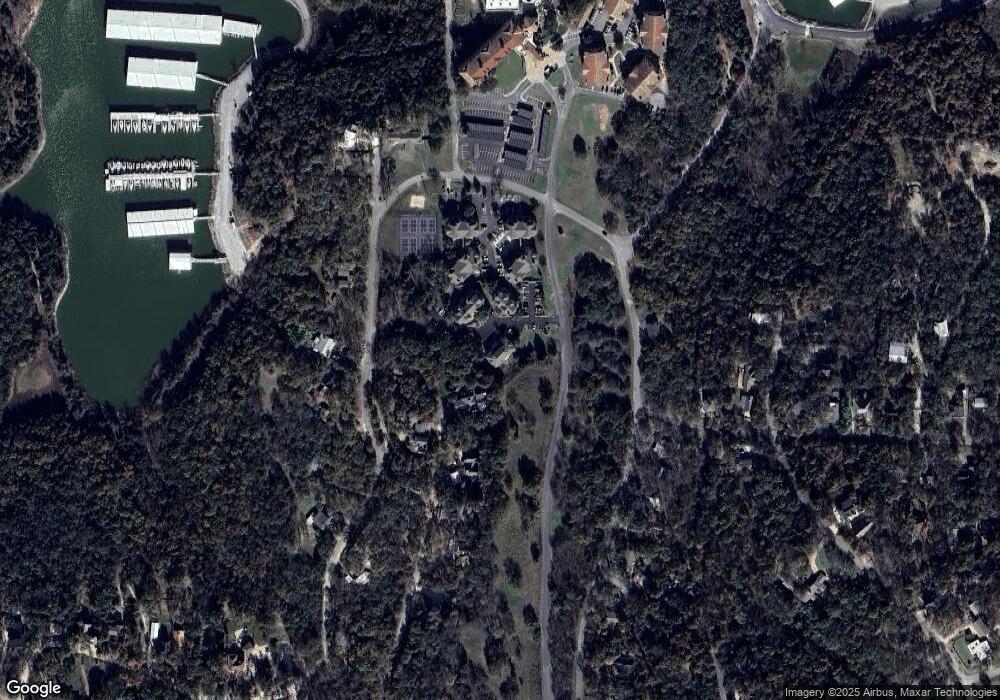
Map
Nearby Homes
- 2116 Tanglewood Blvd Unit A2003
- 2164 Tanglewood Blvd Unit A208
- 2164 Tanglewood Blvd Unit 115
- 2164 Tanglewood Blvd Unit 207
- 2164 Tanglewood Blvd Unit 215
- 2164 Tanglewood Blvd Unit 309
- 2164 Tanglewood Blvd Unit 308
- 2164 Tanglewood Blvd Unit 104
- 2164 Tanglewood Blvd Unit 210
- 128 Bridlepath Dr
- 65 Lakewood Ln
- 271 Lakewood Ln
- 355 Lakecrest Dr
- 91 Shadow Ln
- 188 Hacienda Dr
- 588 Lakepoint Loop
- 766 Lakepoint Loop
- 118 Hacienda Dr
- 455 Lakepoint Loop
- 116 Oak Hills Dr
- 2116 Tanglewood Blvd Unit C107
- 2116 Tanglewood Blvd Unit B1010
- 2116 Tanglewood Blvd Unit B2009
- 2116 Tanglewood Blvd Unit C207
- 2116 Tanglewood Blvd Unit C205
- 2116 Tanglewood Blvd Unit C103
- 2116 Tanglewood Blvd Unit C102
- 2116 Tanglewood Blvd Unit C101
- 2116 Tanglewood Blvd Unit B2010
- 2116 Tanglewood Blvd Unit B2008
- 2116 Tanglewood Blvd Unit 2007
- 2116 Tanglewood Blvd Unit B1009
- 2116 Tanglewood Blvd Unit B1008
- 2116 Tanglewood Blvd Unit B1006
- 2116 Tanglewood Blvd Unit A2004
- 2116 Tanglewood Blvd Unit 2002
- 2116 Tanglewood Blvd Unit A1003
- 2116 Tanglewood Blvd Unit A1001
- 2116 Tanglewood Blvd
- 2116 Tanglewood Blvd Unit 1005B