
Seller's Agent in 2020
Steve Slavin
Coldwell Banker Real Estate Group
(317) 701-5006
14 in this area
429 Total Sales
Estimated Value: $164,000 - $196,000
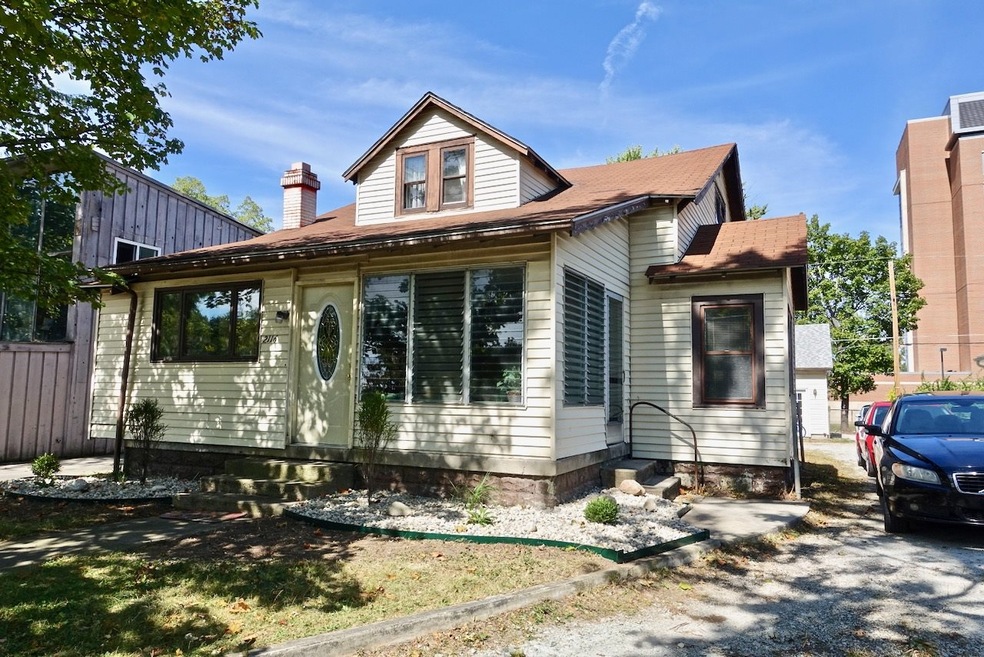
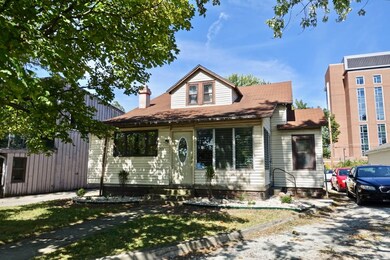
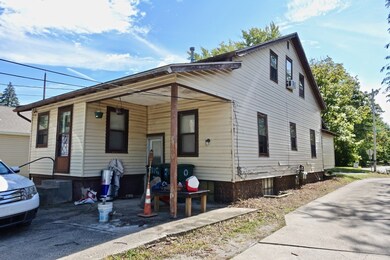
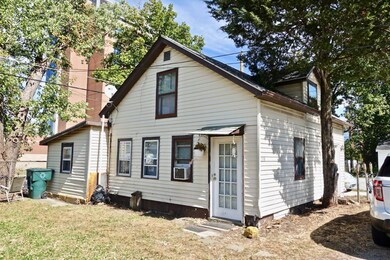
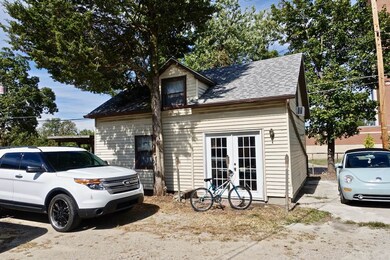
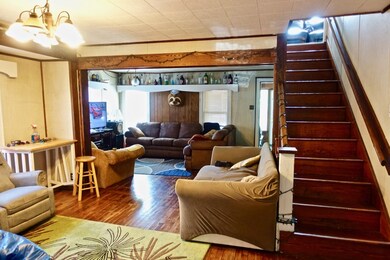
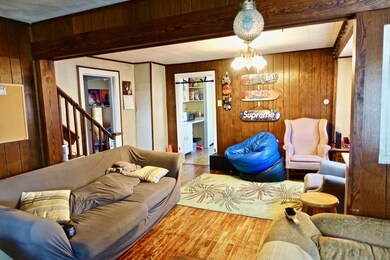
2 HOUSES ON 1 PARCEL NEW BALL STATE! This is a fantastic opportunity for an investor. Located in the popular rental neighborhood of Mapleridge, just NW of the BSU Bell Tower, there is one home that is 4 Bedrooms/2 Baths and another that is 2 bedrooms/1 bath. Both homes currently lease for $230 per bedroom and the tenants pay for gas and electric. The seller pays for water/sewage. ($16,560 p/yr gross lease income). The 4 bedroom is leased through July 2020 and the 2 bedroom is leased through December of 2019. The MLS data shows the stats of the 4 bedroom home. The 2 bed home has a living room (19.x11), bed 1 first floor is 14x12 with an extra closet, bed 2 upstairs is 15x11. The kitchen is 15x10 and has the stackable laundry (included) in the kitchen. The bath is located upstairs. The 4 bedroom home has very large bedrooms! The roof is 10-12 yrs old on both buildings. Recently fully landscaped (cleaned up).
Last Agent to Sell the Property
Coldwell Banker Real Estate Group Listed on: 09/25/2019
Last Buyer's Agent
Scott Locke
Coldwell Banker Real Estate Group
| Date | Buyer | Sale Price | Title Company |
|---|---|---|---|
| Deel Christopher Leonard | -- | In Title |
| Date | Status | Borrower | Loan Amount |
|---|---|---|---|
| Open | Deel Christopher Leonard | $82,400 |
| Date | Event | Price | Change | Sq Ft Price |
|---|---|---|---|---|
| 02/18/2020 02/18/20 | Sold | $103,000 | -6.3% | $56 / Sq Ft |
| 01/16/2020 01/16/20 | Pending | -- | -- | -- |
| 01/10/2020 01/10/20 | Price Changed | $109,900 | -4.4% | $60 / Sq Ft |
| 12/03/2019 12/03/19 | Price Changed | $114,900 | -8.0% | $63 / Sq Ft |
| 10/11/2019 10/11/19 | Price Changed | $124,900 | -3.8% | $68 / Sq Ft |
| 09/25/2019 09/25/19 | For Sale | $129,900 | -- | $71 / Sq Ft |
| Year | Tax Paid | Tax Assessment Tax Assessment Total Assessment is a certain percentage of the fair market value that is determined by local assessors to be the total taxable value of land and additions on the property. | Land | Improvement |
|---|---|---|---|---|
| 2024 | $4,044 | $196,300 | $16,600 | $179,700 |
| 2023 | $3,718 | $180,000 | $16,600 | $163,400 |
| 2022 | $3,322 | $160,200 | $16,600 | $143,600 |
| 2021 | $2,796 | $133,900 | $14,500 | $119,400 |
| 2020 | $2,532 | $120,700 | $11,200 | $109,500 |
| 2019 | $2,368 | $112,500 | $11,200 | $101,300 |
| 2018 | $2,532 | $120,700 | $11,200 | $109,500 |
| 2017 | $2,296 | $108,900 | $10,200 | $98,700 |
| 2016 | $2,296 | $108,900 | $10,200 | $98,700 |
| 2014 | $2,215 | $108,100 | $9,700 | $98,400 |
| 2013 | -- | $107,100 | $9,700 | $97,400 |
Seller's Agent in 2020
Steve Slavin
Coldwell Banker Real Estate Group
(317) 701-5006
14 in this area
429 Total Sales
S
Buyer's Agent in 2020
Scott Locke
Coldwell Banker Real Estate Group
Source: Indiana Regional MLS
MLS Number: 201942149
APN: 18-11-08-202-013.000-003
Disclaimer: Certain information contained herein is derived from information provided by parties other than Homes.com. All information provided is deemed reliable, but is not guaranteed to be accurate and should be independently verified.
![]() IDX information is provided exclusively for personal, non-commercial use, and may not be used for any purpose other than to identify prospective properties consumers may be interested in purchasing. Information is deemed reliable but not guaranteed.
IDX information is provided exclusively for personal, non-commercial use, and may not be used for any purpose other than to identify prospective properties consumers may be interested in purchasing. Information is deemed reliable but not guaranteed.