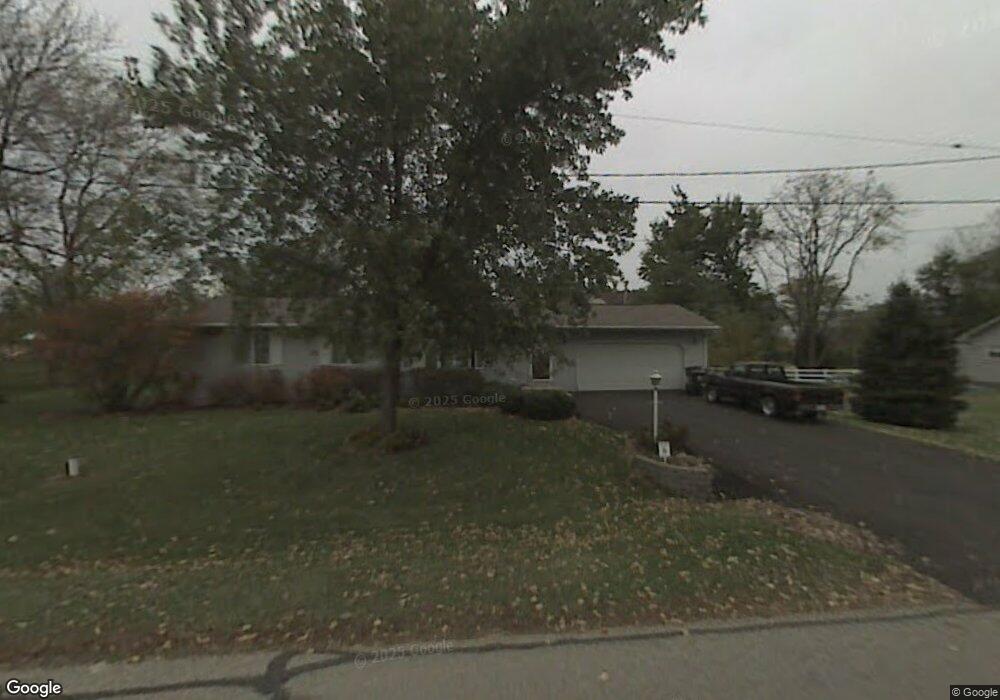
2116 Westward Dr Spring Grove, IL 60081
Estimated Value: $232,000 - $318,000
3
Beds
--
Bath
1,078
Sq Ft
$256/Sq Ft
Est. Value
About This Home
This home is located at 2116 Westward Dr, Spring Grove, IL 60081 and is currently estimated at $276,263, approximately $256 per square foot. 2116 Westward Dr is a home located in McHenry County with nearby schools including Spring Grove Elementary School, Luther J Schilling School, and Nippersink Middle School.
Ownership History
Date
Name
Owned For
Owner Type
Purchase Details
Closed on
Oct 27, 2000
Sold by
Rusher Nicholas D and Rusher Sandra S
Bought by
Jones Jennifer M
Current Estimated Value
Home Financials for this Owner
Home Financials are based on the most recent Mortgage that was taken out on this home.
Original Mortgage
$122,000
Outstanding Balance
$45,019
Interest Rate
7.9%
Estimated Equity
$231,244
Purchase Details
Closed on
Nov 16, 1998
Sold by
Schmitt Sandra S and Rusher Sandra S
Bought by
Rusher Sandra S and Rusher Nicholas D
Home Financials for this Owner
Home Financials are based on the most recent Mortgage that was taken out on this home.
Original Mortgage
$106,500
Interest Rate
6.59%
Purchase Details
Closed on
Nov 30, 1994
Sold by
Smid Mark A and Smid Melonie M
Bought by
Rusher Nicholas D and Schmitt Sandra Sue
Home Financials for this Owner
Home Financials are based on the most recent Mortgage that was taken out on this home.
Original Mortgage
$89,600
Interest Rate
9.19%
Create a Home Valuation Report for This Property
The Home Valuation Report is an in-depth analysis detailing your home's value as well as a comparison with similar homes in the area
Home Values in the Area
Average Home Value in this Area
Purchase History
| Date | Buyer | Sale Price | Title Company |
|---|---|---|---|
| Jones Jennifer M | $162,000 | -- | |
| Rusher Sandra S | -- | Fox Title Company | |
| Rusher Nicholas D | $112,000 | Kishwaukee Title Corporation |
Source: Public Records
Mortgage History
| Date | Status | Borrower | Loan Amount |
|---|---|---|---|
| Open | Jones Jennifer M | $122,000 | |
| Previous Owner | Rusher Sandra S | $106,500 | |
| Previous Owner | Rusher Nicholas D | $89,600 |
Source: Public Records
Tax History Compared to Growth
Tax History
| Year | Tax Paid | Tax Assessment Tax Assessment Total Assessment is a certain percentage of the fair market value that is determined by local assessors to be the total taxable value of land and additions on the property. | Land | Improvement |
|---|---|---|---|---|
| 2024 | $4,555 | $67,557 | $15,071 | $52,486 |
| 2023 | $4,396 | $61,758 | $13,777 | $47,981 |
| 2022 | $4,297 | $55,608 | $12,405 | $43,203 |
| 2021 | $4,150 | $53,372 | $11,906 | $41,466 |
| 2020 | $4,073 | $51,354 | $11,456 | $39,898 |
| 2019 | $4,017 | $49,704 | $11,088 | $38,616 |
| 2018 | $4,040 | $47,650 | $10,630 | $37,020 |
| 2017 | $4,025 | $45,377 | $10,123 | $35,254 |
| 2016 | $3,941 | $42,544 | $9,491 | $33,053 |
| 2013 | -- | $40,226 | $8,974 | $31,252 |
Source: Public Records
Map
Nearby Homes
- 1992 Red Oak Ln
- LOT 9 Mayo Ct
- 2003 Red Oak Ln
- 1876 Red Oak Ln
- Lot 36 Red Oak Ln
- LOT 40 Red Oak Ln
- 7393 English Oak Ln
- 7392 English Oak Ln
- 2214 Main Street Rd
- 7389 English Oak Ln
- 2150 U S 12
- 1979 Red Oak Ln
- 7381 English Oak Ln
- 7377 English Oak Ln
- 7388 English Oak Ln
- 1975 Red Oak Ln
- 7373 English Oak Ln
- 1971 Red Oak Ln
- 7369 English Oak Ln
- 1852 Red Oak Ln
- 2202 Westward Dr
- 2112 Westward Dr
- 7615 Blivin St
- 7704 Broadview Ct
- 7716 Broadview Ct
- 7701 Blivin St
- 7605 Blivin St
- 7711 Broadview Ct
- 7713 Broadview Ct
- 7715 Broadview Ct
- 2150 N Us Highway 12
- 2208 U S 12
- 2208 N Us Highway 12
- 2213 Westward Dr
- 7717 Broadview Ct
- 2215 N Us Highway 12
- 2207 N Us Highway 12 Unit G
- 2207 N Us Highway 12 Unit BGHIJ
- 2207 N Us Highway 12 Unit F
- 2207 N Us Highway 12 Unit B