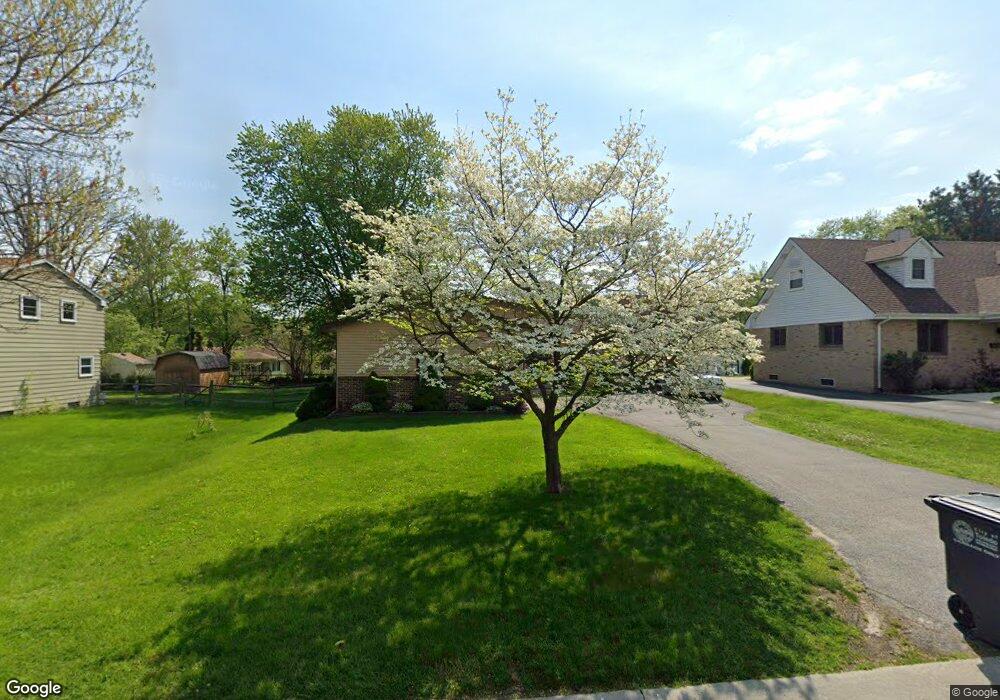
2116 Woonsocket Rd Toledo, OH 43615
Reynolds Corners NeighborhoodEstimated Value: $185,000 - $234,000
3
Beds
2
Baths
1,848
Sq Ft
$110/Sq Ft
Est. Value
About This Home
This home is located at 2116 Woonsocket Rd, Toledo, OH 43615 and is currently estimated at $203,835, approximately $110 per square foot. 2116 Woonsocket Rd is a home located in Lucas County with nearby schools including Hawkins Elementary School, Rogers High School, and St. Benedict Catholic School.
Ownership History
Date
Name
Owned For
Owner Type
Purchase Details
Closed on
May 20, 2010
Sold by
Harris Roxanne M
Bought by
Harris Donmetric L
Current Estimated Value
Purchase Details
Closed on
Jun 7, 2000
Sold by
Sandlin Jesse L and Sandlin Renee L
Bought by
Harris Don Metric L and Harris Roxane
Home Financials for this Owner
Home Financials are based on the most recent Mortgage that was taken out on this home.
Original Mortgage
$128,503
Outstanding Balance
$43,081
Interest Rate
8.14%
Mortgage Type
FHA
Estimated Equity
$160,754
Purchase Details
Closed on
May 2, 1995
Sold by
Byrd John A
Bought by
Sandlin Jesse L and Sandlin Renee L
Home Financials for this Owner
Home Financials are based on the most recent Mortgage that was taken out on this home.
Original Mortgage
$97,350
Interest Rate
8.42%
Mortgage Type
New Conventional
Purchase Details
Closed on
May 28, 1991
Sold by
Jiannuzzi Richard A
Purchase Details
Closed on
May 8, 1989
Sold by
Bruzda James and Bruzda Marsha
Create a Home Valuation Report for This Property
The Home Valuation Report is an in-depth analysis detailing your home's value as well as a comparison with similar homes in the area
Home Values in the Area
Average Home Value in this Area
Purchase History
| Date | Buyer | Sale Price | Title Company |
|---|---|---|---|
| Harris Donmetric L | -- | Attorney | |
| Harris Don Metric L | $129,200 | Louisville Title Agency For | |
| Sandlin Jesse L | $102,500 | -- | |
| -- | $84,000 | -- | |
| -- | $76,000 | -- |
Source: Public Records
Mortgage History
| Date | Status | Borrower | Loan Amount |
|---|---|---|---|
| Open | Harris Don Metric L | $128,503 | |
| Closed | Sandlin Jesse L | $97,350 |
Source: Public Records
Tax History
| Year | Tax Paid | Tax Assessment Tax Assessment Total Assessment is a certain percentage of the fair market value that is determined by local assessors to be the total taxable value of land and additions on the property. | Land | Improvement |
|---|---|---|---|---|
| 2025 | -- | $43,960 | $6,790 | $37,170 |
| 2024 | $1,389 | $43,960 | $6,790 | $37,170 |
| 2023 | $2,561 | $38,780 | $5,950 | $32,830 |
| 2022 | $2,535 | $38,780 | $5,950 | $32,830 |
| 2021 | $2,618 | $38,780 | $5,950 | $32,830 |
| 2020 | $2,473 | $32,060 | $4,935 | $27,125 |
| 2019 | $2,406 | $32,060 | $4,935 | $27,125 |
| 2018 | $2,331 | $32,060 | $4,935 | $27,125 |
| 2017 | $2,238 | $28,490 | $5,075 | $23,415 |
| 2016 | $2,255 | $81,400 | $14,500 | $66,900 |
| 2015 | $2,262 | $81,400 | $14,500 | $66,900 |
| 2014 | $1,792 | $28,500 | $5,080 | $23,420 |
| 2013 | $1,792 | $28,500 | $5,080 | $23,420 |
Source: Public Records
Map
Nearby Homes
- 4936 Fleet Rd
- 1923 Eileen Rd
- 2009 Willowhill Ln
- 4923 Cranston Dr
- 1909 Atwood Rd
- 4705 W Bancroft St
- 1933 Grecourt Dr
- 2208 Valley Brook Dr
- 4515 W Bancroft St Unit 28
- 4521 W Bancroft St
- 4519 W Bancroft St Unit 39
- 3 Stableside S
- 15 Stableside N
- 5041 Ancil Rd
- 4243 W Bancroft St Unit 205w
- 4309 Brookside Rd
- 5444 N Citation Rd
- 2203 Innisbrook Rd
- 5001 Golden Rd
- 4057 Hillandale Rd
- 2110 Woonsocket Rd
- 2124 Woonsocket Rd
- 2104 Woonsocket Rd
- 2115 Eileen Rd
- 2123 Eileen Rd
- 2109 Eileen Rd
- 2066 Woonsocket Rd
- 2117 Woonsocket Rd
- 2065 Eileen Rd
- 2125 Woonsocket Rd
- 2109 Woonsocket Rd
- 2060 Woonsocket Rd
- 2143 Eileen Rd
- 2131 Woonsocket Rd
- 2101 Woonsocket Rd
- 2059 Eileen Rd
- 2116 Eileen Rd
- 2061 Woonsocket Rd
- 2053 Eileen Rd
- 4903 W Bancroft St
Your Personal Tour Guide
Ask me questions while you tour the home.