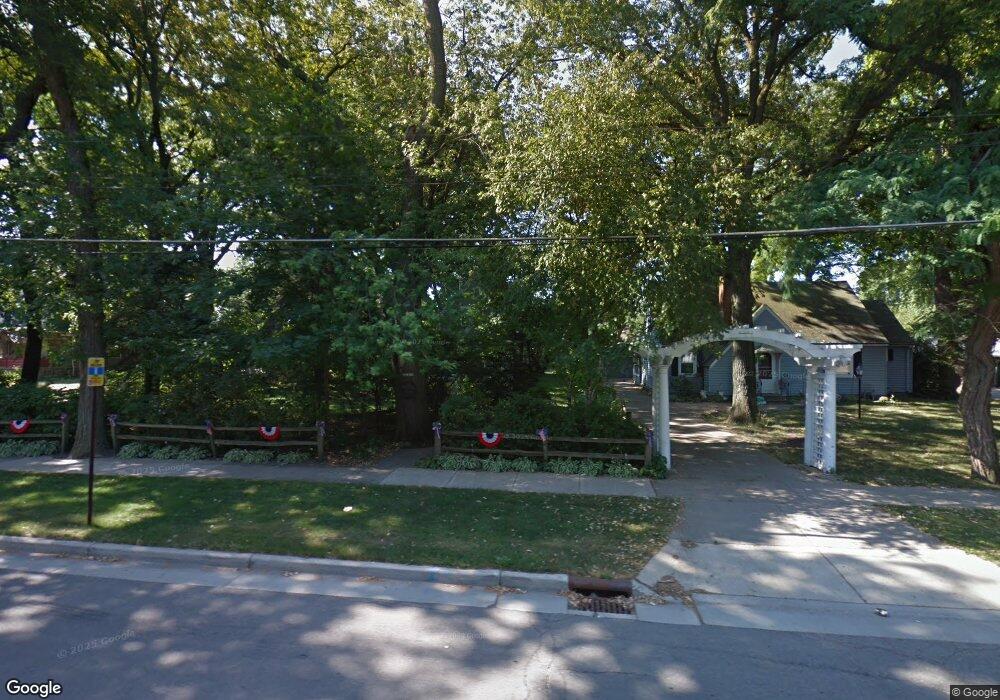
2117 35th St Kenosha, WI 53140
Grant NeighborhoodEstimated Value: $251,000 - $275,099
2
Beds
2
Baths
1,350
Sq Ft
$196/Sq Ft
Est. Value
About This Home
This home is located at 2117 35th St, Kenosha, WI 53140 and is currently estimated at $264,775, approximately $196 per square foot. 2117 35th St is a home located in Kenosha County with nearby schools including Grant Elementary School, Washington Middle School, and Bradford High School.
Ownership History
Date
Name
Owned For
Owner Type
Purchase Details
Closed on
May 18, 2020
Sold by
Strash David M and Strash Patricia A
Bought by
Bermingham Edward R and Bermingham Justin E
Current Estimated Value
Home Financials for this Owner
Home Financials are based on the most recent Mortgage that was taken out on this home.
Original Mortgage
$168,780
Outstanding Balance
$149,562
Interest Rate
3.3%
Mortgage Type
New Conventional
Estimated Equity
$115,213
Create a Home Valuation Report for This Property
The Home Valuation Report is an in-depth analysis detailing your home's value as well as a comparison with similar homes in the area
Home Values in the Area
Average Home Value in this Area
Purchase History
| Date | Buyer | Sale Price | Title Company |
|---|---|---|---|
| Bermingham Edward R | $174,000 | None Available |
Source: Public Records
Mortgage History
| Date | Status | Borrower | Loan Amount |
|---|---|---|---|
| Open | Bermingham Edward R | $168,780 |
Source: Public Records
Tax History Compared to Growth
Tax History
| Year | Tax Paid | Tax Assessment Tax Assessment Total Assessment is a certain percentage of the fair market value that is determined by local assessors to be the total taxable value of land and additions on the property. | Land | Improvement |
|---|---|---|---|---|
| 2024 | $3,486 | $149,800 | $39,700 | $110,100 |
| 2023 | $3,486 | $149,800 | $39,700 | $110,100 |
| 2022 | $10,603 | $149,800 | $39,700 | $110,100 |
| 2021 | $3,752 | $149,800 | $39,700 | $110,100 |
| 2020 | $3,752 | $149,800 | $39,700 | $110,100 |
| 2019 | $3,606 | $149,800 | $39,700 | $110,100 |
| 2018 | $3,547 | $133,200 | $39,700 | $93,500 |
| 2017 | $3,485 | $133,200 | $39,700 | $93,500 |
| 2016 | $3,406 | $133,200 | $39,700 | $93,500 |
| 2015 | $3,475 | $130,400 | $43,200 | $87,200 |
| 2014 | $3,449 | $130,400 | $43,200 | $87,200 |
Source: Public Records
Map
Nearby Homes