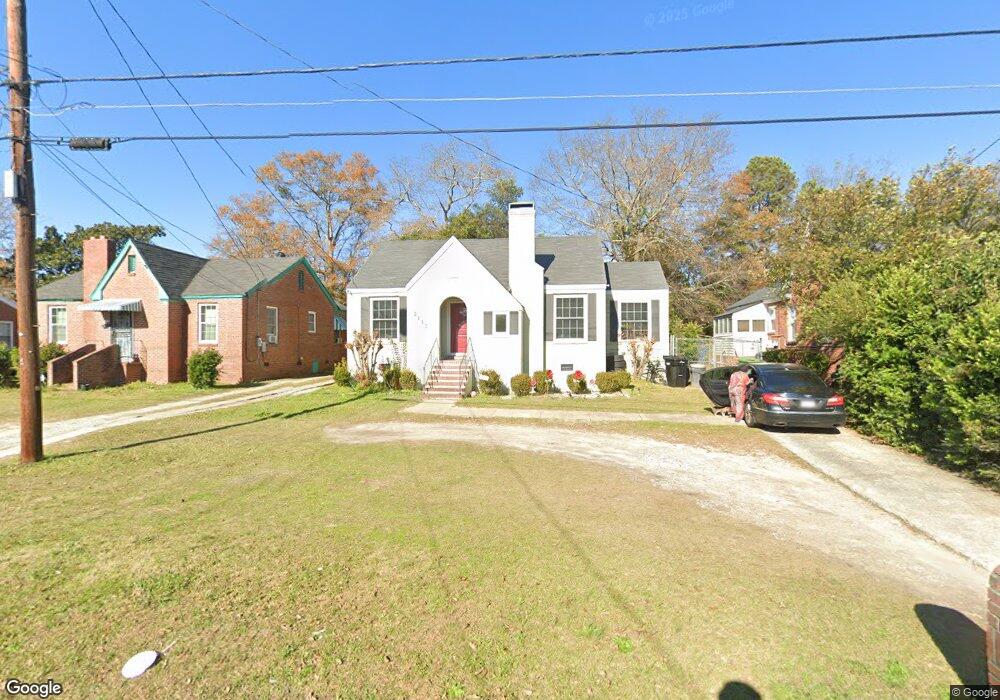
2117 7th St Columbus, GA 31906
East Wynnton-Wynnton Hill NeighborhoodEstimated Value: $98,000 - $144,000
3
Beds
3
Baths
1,421
Sq Ft
$84/Sq Ft
Est. Value
About This Home
This home is located at 2117 7th St, Columbus, GA 31906 and is currently estimated at $119,124, approximately $83 per square foot. 2117 7th St is a home located in Muscogee County with nearby schools including Davis Elementary School, Baker Middle School, and Carver High School.
Ownership History
Date
Name
Owned For
Owner Type
Purchase Details
Closed on
Jul 31, 2013
Sold by
Cchi Asset Management Llc
Bought by
Leverich Jacquline G
Current Estimated Value
Home Financials for this Owner
Home Financials are based on the most recent Mortgage that was taken out on this home.
Original Mortgage
$79,263
Outstanding Balance
$57,700
Interest Rate
3.87%
Mortgage Type
FHA
Estimated Equity
$61,424
Purchase Details
Closed on
Dec 1, 2010
Sold by
Columbus Housing Initiative Inc
Bought by
Chi Asset Management Llc
Purchase Details
Closed on
Dec 23, 2009
Sold by
Secretary Of Housing & Urban Development
Bought by
Columbus Housing Initiutive Inc
Purchase Details
Closed on
Mar 3, 2009
Sold by
Georgia Housing & Finance Authority
Bought by
Secretary Of Housing And Urban Developme
Create a Home Valuation Report for This Property
The Home Valuation Report is an in-depth analysis detailing your home's value as well as a comparison with similar homes in the area
Home Values in the Area
Average Home Value in this Area
Purchase History
| Date | Buyer | Sale Price | Title Company |
|---|---|---|---|
| Leverich Jacquline G | $82,000 | -- | |
| Chi Asset Management Llc | -- | None Available | |
| Columbus Housing Initiutive Inc | -- | None Available | |
| Secretary Of Housing And Urban Developme | -- | None Available | |
| Georgia Housing & Finance Authority | $52,890 | None Available |
Source: Public Records
Mortgage History
| Date | Status | Borrower | Loan Amount |
|---|---|---|---|
| Open | Leverich Jacquline G | $79,263 | |
| Closed | Leverich Jacquline G | $5,100 |
Source: Public Records
Tax History Compared to Growth
Tax History
| Year | Tax Paid | Tax Assessment Tax Assessment Total Assessment is a certain percentage of the fair market value that is determined by local assessors to be the total taxable value of land and additions on the property. | Land | Improvement |
|---|---|---|---|---|
| 2025 | $768 | $36,892 | $4,080 | $32,812 |
| 2024 | $767 | $36,892 | $4,080 | $32,812 |
| 2023 | $77 | $36,892 | $4,080 | $32,812 |
| 2022 | $799 | $29,832 | $4,080 | $25,752 |
| 2021 | $792 | $29,008 | $4,080 | $24,928 |
| 2020 | $793 | $29,008 | $4,080 | $24,928 |
| 2019 | $797 | $29,008 | $4,080 | $24,928 |
| 2018 | $797 | $29,008 | $4,080 | $24,928 |
| 2017 | $801 | $29,008 | $4,080 | $24,928 |
| 2016 | $806 | $32,800 | $2,021 | $30,779 |
| 2015 | $807 | $32,800 | $2,021 | $30,779 |
| 2014 | $809 | $32,800 | $2,021 | $30,779 |
| 2013 | -- | $34,959 | $2,021 | $32,938 |
Source: Public Records
Map
Nearby Homes