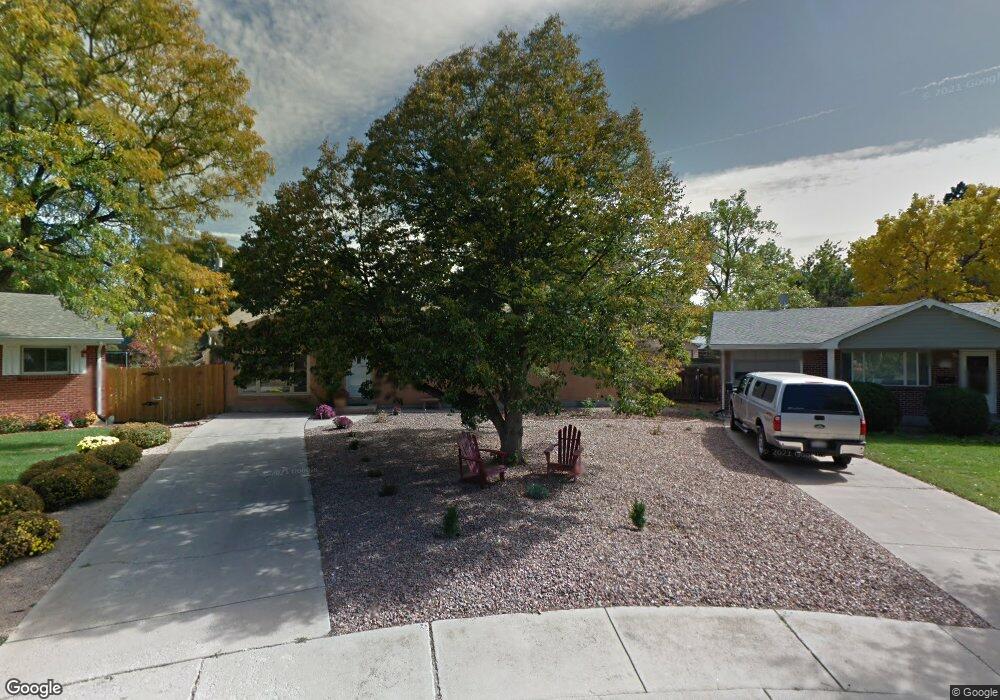
2117 Clarkson Cir Colorado Springs, CO 80909
Palmer Park NeighborhoodEstimated Value: $377,868 - $424,000
4
Beds
3
Baths
1,113
Sq Ft
$363/Sq Ft
Est. Value
About This Home
This home is located at 2117 Clarkson Cir, Colorado Springs, CO 80909 and is currently estimated at $404,467, approximately $363 per square foot. 2117 Clarkson Cir is a home located in El Paso County with nearby schools including Audubon Elementary School, Mann Middle School, and William J. Palmer High School.
Ownership History
Date
Name
Owned For
Owner Type
Purchase Details
Closed on
May 27, 2011
Sold by
Rowley Mark Russell and Rowley Kathaleen Ann
Bought by
Tarpy Matthew H
Current Estimated Value
Home Financials for this Owner
Home Financials are based on the most recent Mortgage that was taken out on this home.
Original Mortgage
$139,127
Outstanding Balance
$96,450
Interest Rate
4.75%
Mortgage Type
FHA
Estimated Equity
$308,017
Purchase Details
Closed on
May 1, 1981
Bought by
Tarpy Matthew H
Purchase Details
Closed on
Feb 26, 1980
Bought by
Tarpy Matthew H
Purchase Details
Closed on
Jan 18, 1978
Bought by
Tarpy Matthew H
Purchase Details
Closed on
Apr 27, 1976
Bought by
Tarpy Matthew H
Purchase Details
Closed on
Oct 3, 1975
Bought by
Tarpy Matthew H
Purchase Details
Closed on
Sep 16, 1970
Bought by
Tarpy Matthew H
Purchase Details
Closed on
Sep 23, 1960
Bought by
Tarpy Matthew H
Purchase Details
Closed on
Jul 28, 1959
Bought by
Tarpy Matthew H
Purchase Details
Closed on
May 27, 1959
Bought by
Tarpy Matthew H
Create a Home Valuation Report for This Property
The Home Valuation Report is an in-depth analysis detailing your home's value as well as a comparison with similar homes in the area
Home Values in the Area
Average Home Value in this Area
Purchase History
| Date | Buyer | Sale Price | Title Company |
|---|---|---|---|
| Tarpy Matthew H | $145,000 | North Amer Title Co Of Co | |
| Tarpy Matthew H | -- | -- | |
| Tarpy Matthew H | -- | -- | |
| Tarpy Matthew H | -- | -- | |
| Tarpy Matthew H | -- | -- | |
| Tarpy Matthew H | -- | -- | |
| Tarpy Matthew H | -- | -- | |
| Tarpy Matthew H | -- | -- | |
| Tarpy Matthew H | -- | -- | |
| Tarpy Matthew H | -- | -- |
Source: Public Records
Mortgage History
| Date | Status | Borrower | Loan Amount |
|---|---|---|---|
| Open | Tarpy Matthew H | $139,127 |
Source: Public Records
Tax History Compared to Growth
Tax History
| Year | Tax Paid | Tax Assessment Tax Assessment Total Assessment is a certain percentage of the fair market value that is determined by local assessors to be the total taxable value of land and additions on the property. | Land | Improvement |
|---|---|---|---|---|
| 2025 | $1,329 | $28,460 | -- | -- |
| 2024 | $1,216 | $28,310 | $4,290 | $24,020 |
| 2022 | $1,201 | $21,470 | $3,180 | $18,290 |
| 2021 | $1,303 | $22,080 | $3,270 | $18,810 |
| 2020 | $1,282 | $18,890 | $2,860 | $16,030 |
| 2019 | $1,275 | $18,890 | $2,860 | $16,030 |
| 2018 | $1,123 | $15,310 | $2,300 | $13,010 |
| 2017 | $1,064 | $15,310 | $2,300 | $13,010 |
| 2016 | $835 | $14,400 | $2,390 | $12,010 |
| 2015 | $832 | $14,400 | $2,390 | $12,010 |
| 2014 | $810 | $13,460 | $2,390 | $11,070 |
Source: Public Records
Map
Nearby Homes
- 2123 Glenn Summer Rd
- 2107 N Circle Dr
- 1908 Winston Rd
- 1927 Downing Dr
- 2035 Downing Dr
- 2112 Alpine Dr
- 2226 Downing Dr
- 2223 Downing Dr
- 2107 Trent Ave
- 3118 E La Salle St
- 2207 Afton Way
- 1909 Trent Ave
- 2443 Clarkson Dr
- 1701 Grant Ave
- 1729 Happiness Dr
- 2014 Afton Way
- 2523 E La Salle St
- 1523 Happiness Dr
- 1927 Snyder Ave
- 2227 Monteagle St
- 2119 Clarkson Cir
- 2115 Clarkson Cir
- 2018 N Circle Dr
- 2113 Clarkson Cir
- 2014 N Circle Dr
- 2121 Clarkson Cir
- 2022 N Circle Dr
- 2010 N Circle Dr
- 2111 Clarkson Dr
- 2026 N Circle Dr
- 2123 Clarkson Dr
- 2125 Clarkson Dr
- 2015 Patrician Way
- 2019 Patrician Way
- 2009 Patrician Way
- 2030 N Circle Dr
- 2023 Patrician Way
- 2005 Patrician Way
- 2103 Clarkson Dr
- 2004 N Circle Dr