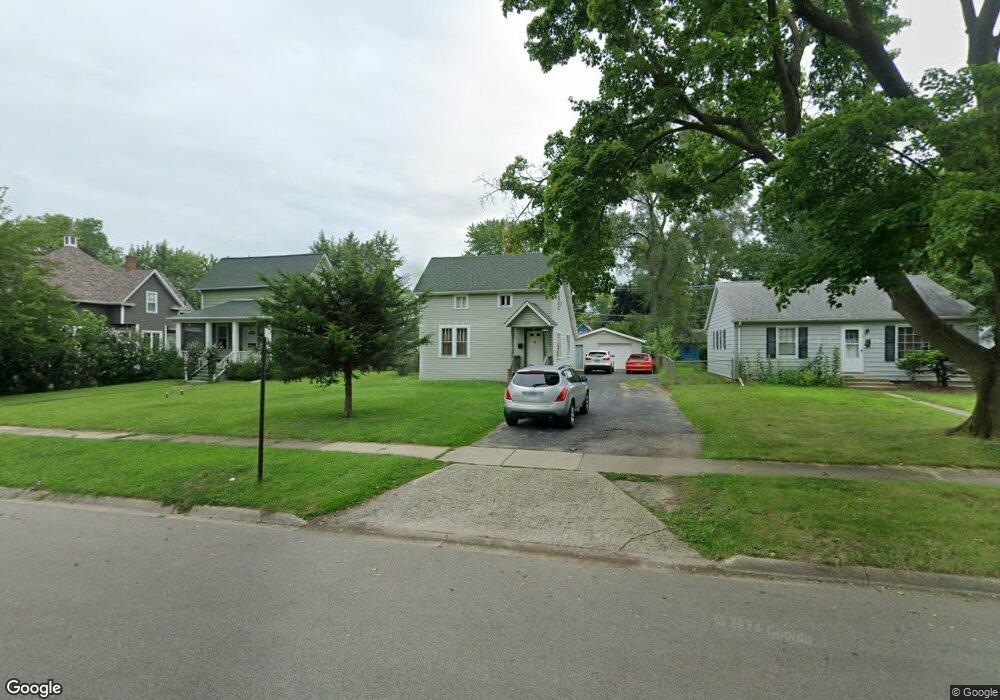
2117 Enoch Ave Zion, IL 60099
Central Zion NeighborhoodEstimated Value: $199,184 - $246,000
3
Beds
2
Baths
1,176
Sq Ft
$188/Sq Ft
Est. Value
About This Home
This home is located at 2117 Enoch Ave, Zion, IL 60099 and is currently estimated at $221,546, approximately $188 per square foot. 2117 Enoch Ave is a home located in Lake County with nearby schools including Zion Central Middle School, Shiloh Park Middle School, and Zion-Benton Township High School.
Ownership History
Date
Name
Owned For
Owner Type
Purchase Details
Closed on
May 13, 2004
Sold by
Torres Abertano
Bought by
Torres Abertano and Torres Evelia
Current Estimated Value
Home Financials for this Owner
Home Financials are based on the most recent Mortgage that was taken out on this home.
Original Mortgage
$127,500
Outstanding Balance
$74,280
Interest Rate
9.1%
Mortgage Type
New Conventional
Estimated Equity
$147,266
Purchase Details
Closed on
Jan 31, 2000
Sold by
Leone Filippa
Bought by
Torres Abertano
Home Financials for this Owner
Home Financials are based on the most recent Mortgage that was taken out on this home.
Original Mortgage
$107,000
Interest Rate
10.63%
Purchase Details
Closed on
Dec 27, 1993
Sold by
Wheary James T W and Wheary Victoria A
Bought by
Leone Filippa
Home Financials for this Owner
Home Financials are based on the most recent Mortgage that was taken out on this home.
Original Mortgage
$71,200
Interest Rate
7.25%
Create a Home Valuation Report for This Property
The Home Valuation Report is an in-depth analysis detailing your home's value as well as a comparison with similar homes in the area
Home Values in the Area
Average Home Value in this Area
Purchase History
| Date | Buyer | Sale Price | Title Company |
|---|---|---|---|
| Torres Abertano | -- | Tristar Title Llc | |
| Torres Abertano | $107,000 | Prairie Title | |
| Leone Filippa | $50,000 | -- |
Source: Public Records
Mortgage History
| Date | Status | Borrower | Loan Amount |
|---|---|---|---|
| Open | Torres Abertano | $127,500 | |
| Previous Owner | Torres Abertano | $107,000 | |
| Previous Owner | Leone Filippa | $71,200 |
Source: Public Records
Tax History Compared to Growth
Tax History
| Year | Tax Paid | Tax Assessment Tax Assessment Total Assessment is a certain percentage of the fair market value that is determined by local assessors to be the total taxable value of land and additions on the property. | Land | Improvement |
|---|---|---|---|---|
| 2024 | $4,187 | $42,939 | $8,312 | $34,627 |
| 2023 | $4,156 | $38,284 | $7,411 | $30,873 |
| 2022 | $4,156 | $35,075 | $6,101 | $28,974 |
| 2021 | $3,929 | $30,908 | $5,723 | $25,185 |
| 2020 | $3,509 | $27,334 | $5,383 | $21,951 |
| 2019 | $3,337 | $25,462 | $5,014 | $20,448 |
| 2018 | $2,923 | $22,798 | $4,750 | $18,048 |
| 2017 | $2,892 | $21,148 | $4,406 | $16,742 |
| 2016 | $2,635 | $19,198 | $4,000 | $15,198 |
| 2015 | $2,450 | $17,419 | $3,629 | $13,790 |
| 2014 | $2,337 | $16,884 | $3,495 | $13,389 |
| 2012 | $2,658 | $17,981 | $3,722 | $14,259 |
Source: Public Records
Map
Nearby Homes
- 2110 Elisha Ave
- 1401 20th St
- 2275 Sheridan Rd
- 2104 Elim Ave
- 1404 19th St
- 1611 19th St
- 1810 21st St
- 1914 Elim Ave
- 1810 Thompson Ave
- 1907 Elim Ave
- 2100 Edina Blvd
- 1903 20th St
- 2207 Gabriel Ave
- 1930 23rd St
- 2037 Gabriel Ave
- 2317 Gideon Ave
- 2318 Gideon Ave
- 1908 Gideon Ave
- 2102 Salem Blvd
- 2409 Gilboa Ave
- 2115 Enoch Ave
- 2119 Enoch Ave
- 2113 Enoch Ave
- 2111 Enoch Ave
- 2201 Enoch Ave
- 2116 Emmaus Ave
- 2118 Emmaus Ave
- 2109 Enoch Ave
- 2116 Enoch Ave Unit 2
- 2114 Emmaus Ave
- 2114 Enoch Ave
- 2114 Enoch Ave Unit 4
- 2122 Enoch Ave
- 2200 Emmaus Ave
- 2107 Enoch Ave
- 2205 Enoch Ave
- 2112 Enoch Ave
- 2110 Emmaus Ave
- 2110 Enoch Ave
- 2202 Emmaus Ave