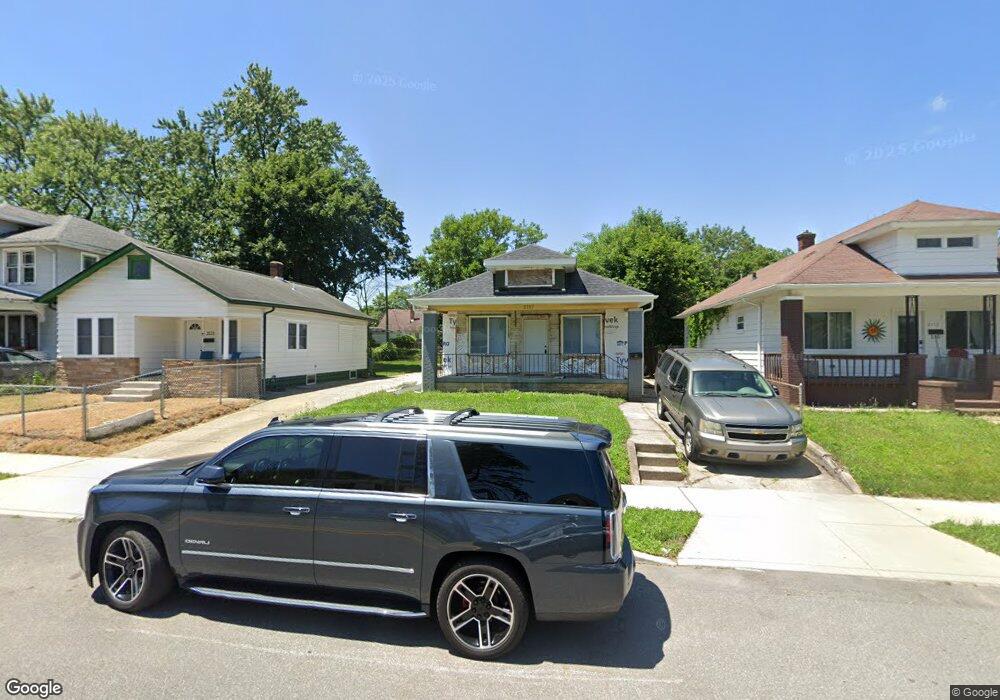
2117 Kemble Ave South Bend, IN 46613
Rum Village NeighborhoodEstimated Value: $96,000 - $137,000
2
Beds
1
Bath
1,152
Sq Ft
$99/Sq Ft
Est. Value
About This Home
This home is located at 2117 Kemble Ave, South Bend, IN 46613 and is currently estimated at $114,604, approximately $99 per square foot. 2117 Kemble Ave is a home located in St. Joseph County with nearby schools including Marshall Traditional School, Clay Intermediate Center, and Monroe Elementary School.
Ownership History
Date
Name
Owned For
Owner Type
Purchase Details
Closed on
Nov 27, 2024
Sold by
Jabez The Home Solutions And Senior Home
Bought by
G3 574 Rentals Llc
Current Estimated Value
Purchase Details
Closed on
Oct 29, 2024
Sold by
Sins Jerome Matthew and Sims Morningstar
Bought by
Jabez The Home Solutions And Senior Home Solu
Purchase Details
Closed on
Jun 15, 2023
Sold by
Sims James L and Sims Viola
Bought by
Sims Jerome Matthew and Sims Morinstar
Purchase Details
Closed on
Jun 23, 2022
Sold by
Valley Goat 15 Llc
Bought by
Sims Viola and Sims James
Purchase Details
Closed on
Sep 28, 2015
Sold by
St Joseph County Auditor
Bought by
Valley Goat 15 Llc
Purchase Details
Closed on
Jan 24, 2013
Sold by
Federal National Mortgage Association
Bought by
Harbour Portfolio Vii Lp
Purchase Details
Closed on
Sep 28, 2012
Sold by
1St Source Bank
Bought by
Federal National Mortgage Association
Create a Home Valuation Report for This Property
The Home Valuation Report is an in-depth analysis detailing your home's value as well as a comparison with similar homes in the area
Home Values in the Area
Average Home Value in this Area
Purchase History
| Date | Buyer | Sale Price | Title Company |
|---|---|---|---|
| G3 574 Rentals Llc | $11,000 | Fidelity National Title Compan | |
| Jabez The Home Solutions And Senior Home Solu | -- | Fidelity National Title Compan | |
| Sims Jerome Matthew | -- | None Listed On Document | |
| Sims Viola | -- | Eslinger Stephen L | |
| Valley Goat 15 Llc | -- | -- | |
| Harbour Portfolio Vii Lp | $11,920 | Servicelink Hopewell Campus | |
| Federal National Mortgage Association | -- | -- |
Source: Public Records
Tax History Compared to Growth
Tax History
| Year | Tax Paid | Tax Assessment Tax Assessment Total Assessment is a certain percentage of the fair market value that is determined by local assessors to be the total taxable value of land and additions on the property. | Land | Improvement |
|---|---|---|---|---|
| 2024 | $5,953 | $105,700 | $5,300 | $100,400 |
| 2023 | $2,565 | $107,600 | $5,300 | $102,300 |
| 2022 | $2,028 | $84,500 | $5,300 | $79,200 |
| 2021 | $1,658 | $67,300 | $5,000 | $62,300 |
| 2020 | $1,401 | $56,600 | $4,200 | $52,400 |
| 2019 | $1,207 | $58,200 | $4,700 | $53,500 |
| 2018 | $1,378 | $55,900 | $4,400 | $51,500 |
| 2017 | $1,177 | $45,500 | $3,700 | $41,800 |
| 2016 | $1,201 | $45,500 | $3,700 | $41,800 |
| 2014 | $1,173 | $44,900 | $3,700 | $41,200 |
Source: Public Records
Map
Nearby Homes
- 2009 Catalpa St
- 914 W Calvert St
- 2213 Kendall St
- 726 W Calvert St
- 2022 Swygart Ave
- PRAIRIE AVE. (Sr 23 ) and Indiana Ave
- 1819 S Scott St
- 1723 Kendall St
- 1637 Kemble Ave
- 1722 Kendall St
- 2126 S Taylor St
- 1202 W Indiana Ave
- 1631 S Scott St
- 1317 W Indiana Ave
- 1413 W Indiana Ave
- 1722 Nash St
- 1601 Magnolia St
- 2005 Prairie Ave
- 1921 W Ewing Ave
- 2620 Emerson Forest Pkwy
- 2113 Kemble Ave
- 2121 Kemble Ave
- 2109 Kemble Ave
- 2125 Kemble Ave
- 2105 Kemble Ave
- 2124 S Douglas St
- 2205 Kemble Ave
- 2110 S Douglas St
- 2106 S Douglas St
- 2126 S Douglas St Unit 24
- 2114 Kemble Ave
- 2118 Kemble Ave
- 2204 S Douglas St
- 2110 Kemble Ave
- 2102 S Douglas St
- 2202 Kemble Ave
- 2102 Kemble Ave
- 2217 Kemble Ave
- 2208 S Douglas St
- 2210 Kemble Ave