Estimated Value: $207,793 - $226,000
3
Beds
2
Baths
1,396
Sq Ft
$155/Sq Ft
Est. Value
About This Home
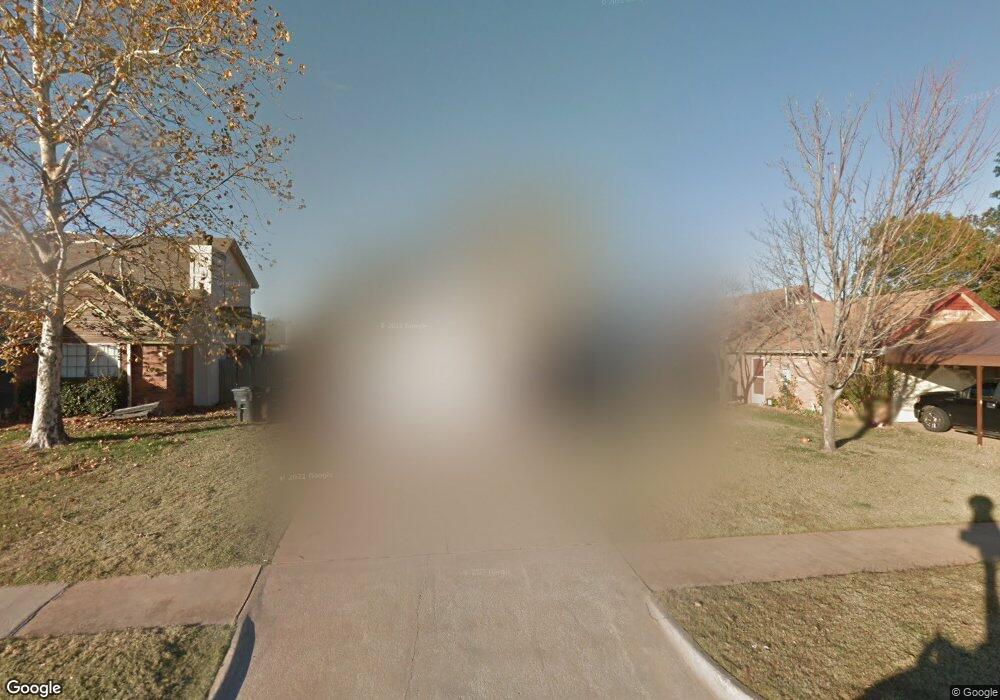
This home is located at 2117 NE 9th St, Moore, OK 73160 and is currently estimated at $216,698, approximately $155 per square foot. 2117 NE 9th St is a home located in Cleveland County with nearby schools including Heritage Trails Elementary School, Highland East Junior High School, and Moore High School.
Ownership History
Date
Name
Owned For
Owner Type
Purchase Details
Closed on
Apr 9, 2013
Sold by
Carlton Rachel M and Carlton Theresa F
Bought by
Migliaccio Steven and Migliaccio Whitney
Current Estimated Value
Home Financials for this Owner
Home Financials are based on the most recent Mortgage that was taken out on this home.
Original Mortgage
$119,298
Outstanding Balance
$83,098
Interest Rate
3.56%
Mortgage Type
FHA
Estimated Equity
$133,600
Purchase Details
Closed on
Apr 9, 2010
Sold by
Burciaga Yesenia and Burciaga Ernesto
Bought by
Carlton Rachel M and Carlton Theresa F
Home Financials for this Owner
Home Financials are based on the most recent Mortgage that was taken out on this home.
Original Mortgage
$117,335
Interest Rate
4.96%
Mortgage Type
FHA
Purchase Details
Closed on
Mar 21, 2002
Sold by
Vicknair Randy B
Bought by
Burciaga Yesenia and Burciaga Ernesto
Create a Home Valuation Report for This Property
The Home Valuation Report is an in-depth analysis detailing your home's value as well as a comparison with similar homes in the area
Home Values in the Area
Average Home Value in this Area
Purchase History
| Date | Buyer | Sale Price | Title Company |
|---|---|---|---|
| Migliaccio Steven | $121,500 | None Available | |
| Carlton Rachel M | $119,500 | Stewart Abstract & Title Of | |
| Burciaga Yesenia | $89,000 | -- |
Source: Public Records
Mortgage History
| Date | Status | Borrower | Loan Amount |
|---|---|---|---|
| Open | Migliaccio Steven | $119,298 | |
| Previous Owner | Carlton Rachel M | $117,335 |
Source: Public Records
Tax History
| Year | Tax Paid | Tax Assessment Tax Assessment Total Assessment is a certain percentage of the fair market value that is determined by local assessors to be the total taxable value of land and additions on the property. | Land | Improvement |
|---|---|---|---|---|
| 2025 | $2,105 | $17,190 | $2,959 | $14,231 |
| 2024 | $1,986 | $16,371 | $3,045 | $13,326 |
| 2023 | $1,901 | $15,591 | $3,111 | $12,480 |
| 2022 | $1,837 | $14,849 | $2,951 | $11,898 |
| 2021 | $1,757 | $14,142 | $2,400 | $11,742 |
| 2020 | $1,758 | $14,142 | $2,400 | $11,742 |
| 2019 | $1,791 | $14,142 | $2,400 | $11,742 |
| 2018 | $1,792 | $14,142 | $2,400 | $11,742 |
| 2017 | $1,800 | $14,142 | $0 | $0 |
| 2016 | $1,812 | $14,142 | $2,400 | $11,742 |
| 2015 | $1,621 | $13,977 | $1,200 | $12,777 |
| 2014 | $1,723 | $14,511 | $1,200 | $13,311 |
Source: Public Records
Map
Nearby Homes
- 1824 NE 11th St
- 1317 Washington Cir
- 1013 Oak Creek Dr
- 1105 Oak Creek Dr
- 930 Estell Dr
- 1401 NE 11th St
- 1101 Bronze Medal Rd
- 625 Champion Ln
- 0 NE 12th St
- 1320 Sonoma Lakes Blvd
- 112 Wellington Ln
- 1521 NE 1st St
- 1805 SE 1st St
- 617 Randall Dr
- 1809 Parkway Dr
- 1124 NE 8th St
- 105 S Olde Bridge Rd
- 1700 Pendleton Place
- 217 N Morgan Dr
- 401 S Bryant Ave
- 2121 NE 9th St
- 2116 NE 10th St
- 2120 NE 10th St
- 2112 NE 10th St
- 2125 NE 9th St
- 2109 NE 9th St
- 2108 NE 10th St
- 2124 NE 10th St
- 2116 NE 9th St
- 2105 NE 9th St
- 2129 NE 9th St
- 2120 NE 9th St
- 2112 NE 9th St
- 2128 NE 10th St
- 2108 NE 9th St
- 1100 Leafhurst Rd
- 2124 NE 9th St
- 2201 NE 9th St
- 2104 NE 9th St
- 2128 NE 9th St
Your Personal Tour Guide
Ask me questions while you tour the home.