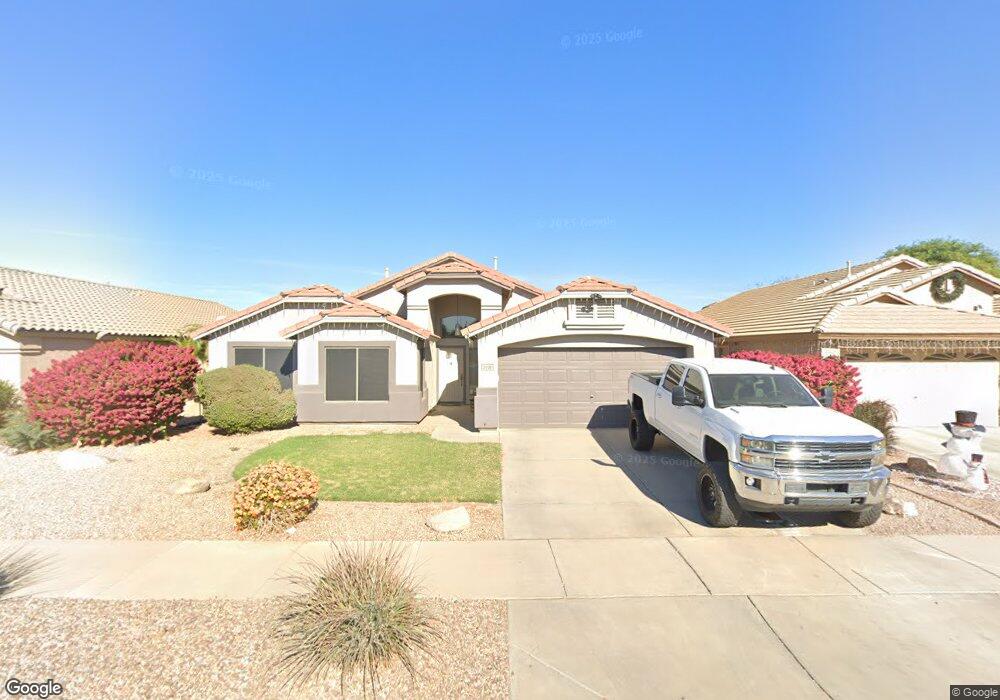
21178 E Camina Plata Queen Creek, AZ 85142
The Villages at Queen Creek NeighborhoodEstimated Value: $406,969 - $463,000
4
Beds
2
Baths
1,926
Sq Ft
$231/Sq Ft
Est. Value
About This Home
This home is located at 21178 E Camina Plata, Queen Creek, AZ 85142 and is currently estimated at $444,992, approximately $231 per square foot. 21178 E Camina Plata is a home located in Maricopa County with nearby schools including Frances Brandon-Pickett Elementary School, Newell Barney Middle School, and Crismon High School.
Ownership History
Date
Name
Owned For
Owner Type
Purchase Details
Closed on
Feb 15, 2017
Sold by
Lavanaway Lavanaway A and Lavanaway Susan J
Bought by
Herrera Ruby
Current Estimated Value
Home Financials for this Owner
Home Financials are based on the most recent Mortgage that was taken out on this home.
Original Mortgage
$213,787
Outstanding Balance
$177,254
Interest Rate
4.25%
Mortgage Type
FHA
Estimated Equity
$267,738
Purchase Details
Closed on
May 2, 2014
Sold by
Lavanaway A Sam
Bought by
Lavanaway A Sam and Lavanaway Susan J
Home Financials for this Owner
Home Financials are based on the most recent Mortgage that was taken out on this home.
Original Mortgage
$140,200
Interest Rate
4.25%
Mortgage Type
VA
Purchase Details
Closed on
Oct 22, 2002
Sold by
Continental Homes Inc
Bought by
Lavanaway A Sam
Home Financials for this Owner
Home Financials are based on the most recent Mortgage that was taken out on this home.
Original Mortgage
$161,150
Interest Rate
6.09%
Mortgage Type
VA
Create a Home Valuation Report for This Property
The Home Valuation Report is an in-depth analysis detailing your home's value as well as a comparison with similar homes in the area
Home Values in the Area
Average Home Value in this Area
Purchase History
| Date | Buyer | Sale Price | Title Company |
|---|---|---|---|
| Herrera Ruby | $217,732 | Security Title Agency Inc | |
| Lavanaway A Sam | -- | Equity Title Agency | |
| Lavanaway A Sam | $162,683 | Century Title Agency Inc | |
| Continental Homes Inc | -- | Century Title Agency Inc |
Source: Public Records
Mortgage History
| Date | Status | Borrower | Loan Amount |
|---|---|---|---|
| Open | Herrera Ruby | $213,787 | |
| Previous Owner | Lavanaway A Sam | $140,200 | |
| Previous Owner | Lavanaway A Sam | $161,150 |
Source: Public Records
Tax History Compared to Growth
Tax History
| Year | Tax Paid | Tax Assessment Tax Assessment Total Assessment is a certain percentage of the fair market value that is determined by local assessors to be the total taxable value of land and additions on the property. | Land | Improvement |
|---|---|---|---|---|
| 2025 | $1,591 | $17,271 | -- | -- |
| 2024 | $1,631 | $16,449 | -- | -- |
| 2023 | $1,631 | $33,610 | $6,720 | $26,890 |
| 2022 | $1,585 | $24,630 | $4,920 | $19,710 |
| 2021 | $1,619 | $22,510 | $4,500 | $18,010 |
| 2020 | $1,566 | $21,030 | $4,200 | $16,830 |
| 2019 | $1,558 | $18,910 | $3,780 | $15,130 |
| 2018 | $1,468 | $17,670 | $3,530 | $14,140 |
| 2017 | $1,425 | $16,550 | $3,310 | $13,240 |
| 2016 | $1,628 | $15,420 | $3,080 | $12,340 |
| 2015 | $1,467 | $13,770 | $2,750 | $11,020 |
Source: Public Records
Map
Nearby Homes
- 22940 S 213th St
- 21048 E Arroyo Verde Dr
- 21337 E Camina Plata
- 21111 E Aspen Valley Dr
- 23444 S 212th Way
- 21022 E Arroyo Verde Ct
- 22736 S 212th St
- 21152 E Poco Calle
- 21033 E Camina Buena Vista Ct
- 20988 E Via Del Rancho
- 21024 E Poco Calle
- 21388 E Via Del Oro
- 21112 E Via Del Sol
- 21039 E Poco Calle
- 20895 E Via Del Rancho
- 21082 E Via Del Sol
- 21026 E Calle Luna Ct
- SanTan Plan at Hastings Farms - Creekside Series
- Providence Plan at Hastings Farms - Creekside Series
- Mohave Plan at Hastings Farms - Creekside Series
- 21184 E Camina Plata
- 21172 E Camina Plata
- 21166 E Camina Plata
- 21190 E Camina Plata
- 21183 E Via Del Oro
- 21189 E Via Del Oro
- 21177 E Via Del Oro
- 21171 E Via Del Oro
- 21195 E Via Del Oro
- 21187 E Camina Plata
- 21181 E Camina Plata
- 21160 E Camina Plata
- 21193 E Camina Plata
- 21175 E Camina Plata
- 21199 E Camina Plata
- 21165 E Via Del Oro
- 21154 E Camina Plata
- 21171 E Camina Plata
- 21159 E Via Del Oro
- 23097 S 212th Place