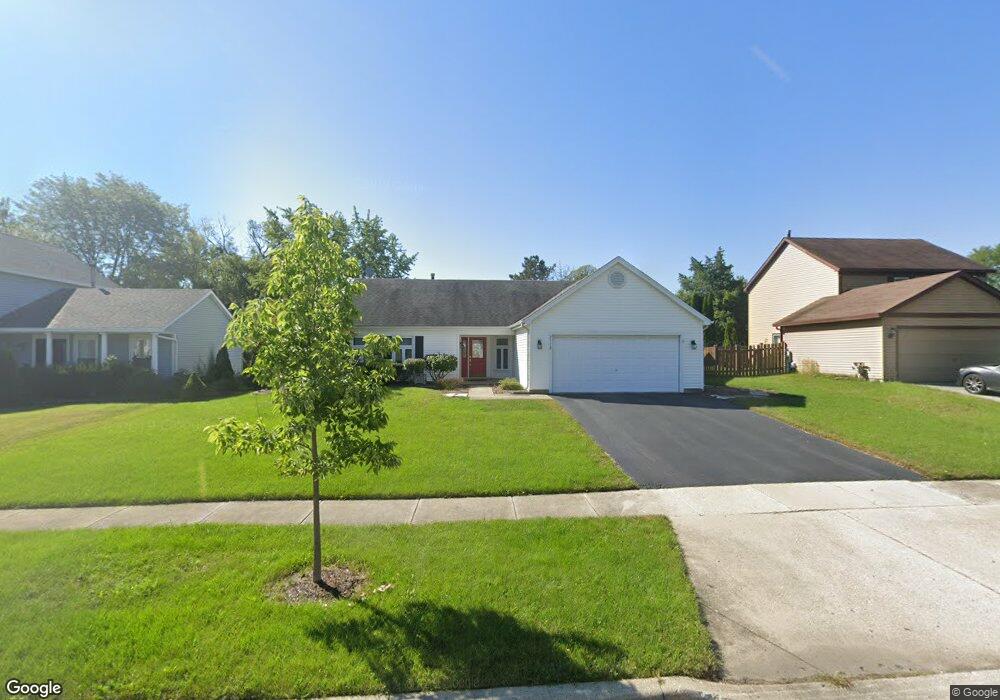
2118 Appaloosa Ct E Unit 5 Wheaton, IL 60189
Estimated Value: $410,667 - $493,000
3
Beds
2
Baths
1,298
Sq Ft
$354/Sq Ft
Est. Value
About This Home
This home is located at 2118 Appaloosa Ct E Unit 5, Wheaton, IL 60189 and is currently estimated at $459,917, approximately $354 per square foot. 2118 Appaloosa Ct E Unit 5 is a home located in DuPage County with nearby schools including Arbor View Elementary School, Glen Crest Middle School, and Glenbard South High School.
Ownership History
Date
Name
Owned For
Owner Type
Purchase Details
Closed on
Mar 8, 2011
Sold by
Vander Wal Daniel J and Vander Wal Virginia R
Bought by
Prindible William M and Prindible Patricia
Current Estimated Value
Home Financials for this Owner
Home Financials are based on the most recent Mortgage that was taken out on this home.
Original Mortgage
$244,672
Outstanding Balance
$167,797
Interest Rate
4.75%
Mortgage Type
FHA
Estimated Equity
$292,120
Purchase Details
Closed on
Mar 30, 2007
Sold by
Townsend Jeffrey R and Townsend Sherri L
Bought by
Vander Wal Daniel J and Vander Wal Virginia R
Home Financials for this Owner
Home Financials are based on the most recent Mortgage that was taken out on this home.
Original Mortgage
$265,500
Interest Rate
7.9%
Mortgage Type
Purchase Money Mortgage
Purchase Details
Closed on
Apr 23, 2004
Sold by
Downey Pamela B and Petrarca Pamela B
Bought by
Herlien Sherri L and Townsend Jeffrey R
Home Financials for this Owner
Home Financials are based on the most recent Mortgage that was taken out on this home.
Original Mortgage
$174,000
Interest Rate
5.5%
Mortgage Type
Purchase Money Mortgage
Create a Home Valuation Report for This Property
The Home Valuation Report is an in-depth analysis detailing your home's value as well as a comparison with similar homes in the area
Home Values in the Area
Average Home Value in this Area
Purchase History
| Date | Buyer | Sale Price | Title Company |
|---|---|---|---|
| Prindible William M | $255,000 | Multiple | |
| Vander Wal Daniel J | $295,000 | First American Title | |
| Herlien Sherri L | $254,000 | Cti |
Source: Public Records
Mortgage History
| Date | Status | Borrower | Loan Amount |
|---|---|---|---|
| Open | Prindible William M | $244,672 | |
| Previous Owner | Vander Wal Daniel J | $265,500 | |
| Previous Owner | Herlien Sherri L | $174,000 |
Source: Public Records
Tax History
| Year | Tax Paid | Tax Assessment Tax Assessment Total Assessment is a certain percentage of the fair market value that is determined by local assessors to be the total taxable value of land and additions on the property. | Land | Improvement |
|---|---|---|---|---|
| 2024 | $7,486 | $107,097 | $36,970 | $70,127 |
| 2023 | $7,134 | $98,580 | $34,030 | $64,550 |
| 2022 | $6,864 | $93,160 | $32,160 | $61,000 |
| 2021 | $6,862 | $90,950 | $31,400 | $59,550 |
| 2020 | $6,927 | $90,100 | $31,110 | $58,990 |
| 2019 | $6,744 | $87,720 | $30,290 | $57,430 |
| 2018 | $6,918 | $88,830 | $28,540 | $60,290 |
| 2017 | $6,435 | $85,560 | $27,490 | $58,070 |
| 2016 | $6,333 | $82,140 | $26,390 | $55,750 |
| 2015 | $6,280 | $78,370 | $25,180 | $53,190 |
| 2014 | $6,008 | $74,160 | $22,010 | $52,150 |
| 2013 | $5,827 | $74,390 | $22,080 | $52,310 |
Source: Public Records
Map
Nearby Homes
- 23W070 Mulberry Ln
- 1580 College Ln S
- 23W160 Woodcroft Dr
- 2S744 Lakeside Dr Unit 21
- 3S481 Osage Dr
- 1720 Lakecliffe Dr Unit A
- 1922 Cambridge Ln
- 22W425 Arbor Ln
- 3S240 Burr Oak Dr
- 448 Raintree Ct Unit 1C
- 453 Raintree Dr Unit 5A
- 453 Raintree Dr Unit 1H
- 470 Fawell Blvd Unit 203
- 429 Sandhurst Cir Unit 1
- 953 Cordova Ct
- 440 Raintree Ct Unit 1G
- 478 Raintree Ct Unit 2B
- 450 Raintree Ct Unit 2M
- 450 Raintree Ct Unit 2B
- 131 Christina Cir
- 2132 Appaloosa Ct E
- 2106 Appaloosa Ct E
- 2079 Scottdale Cir
- 2160 Appaloosa Ct E
- 2073 Scottdale Cir Unit 5
- 2125 Appaloosa Ct E
- 2162 Acorn Ct
- 2135 Appaloosa Ct E
- 2154 Acorn Ct
- 2103 Appaloosa Ct E
- 2170 Acorn Ct
- 2092 Appaloosa Ct W
- 2172 Appaloosa Ct E
- 2157 Appaloosa Ct E
- 2065 Scottdale Cir
- 2151 Acorn Ct
- 2169 Appaloosa Ct E
- 2178 Acorn Ct
- 2076 Scottdale Cir
- 2186 Appaloosa Ct E
Your Personal Tour Guide
Ask me questions while you tour the home.