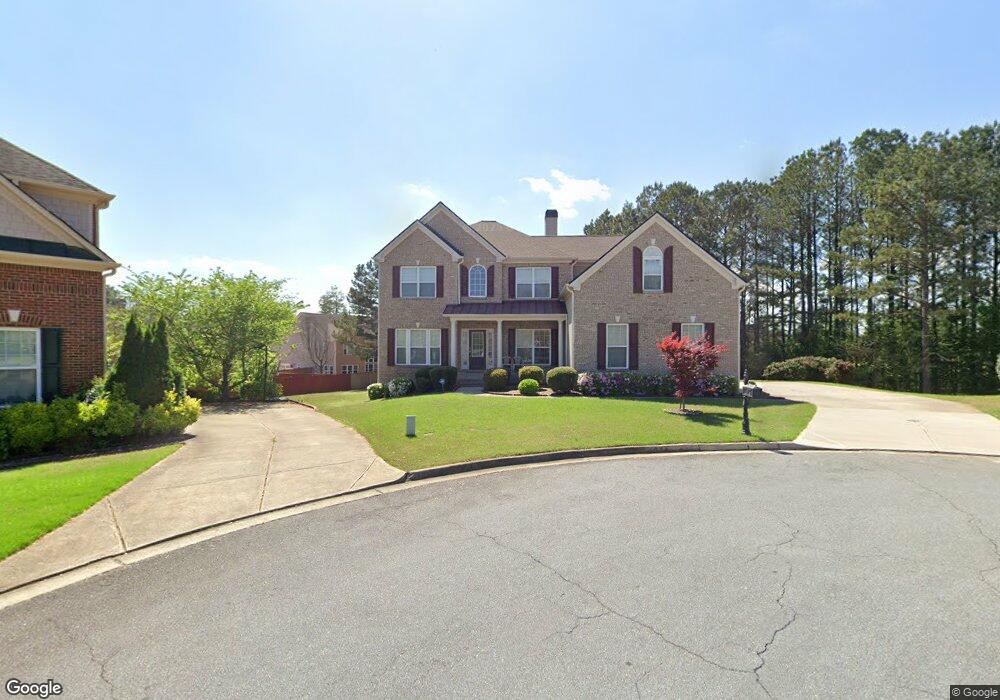
2118 Chaseford Ln Powder Springs, GA 30127
Estimated Value: $591,818 - $679,000
5
Beds
4
Baths
4,154
Sq Ft
$153/Sq Ft
Est. Value
About This Home
This home is located at 2118 Chaseford Ln, Powder Springs, GA 30127 and is currently estimated at $634,455, approximately $152 per square foot. 2118 Chaseford Ln is a home located in Cobb County with nearby schools including Dowell Elementary School, Tapp Middle School, and McEachern High School.
Ownership History
Date
Name
Owned For
Owner Type
Purchase Details
Closed on
Jul 17, 2023
Sold by
Patel Ambaram U and Patel Vasumatiben
Bought by
Ambaram And Vasumatiben Patel Revocable Trust and Patel
Current Estimated Value
Purchase Details
Closed on
Aug 26, 2009
Sold by
Jones Andrew L and Jones Linda M
Bought by
Patel Ambaram U and Patel Vasumatiben
Home Financials for this Owner
Home Financials are based on the most recent Mortgage that was taken out on this home.
Original Mortgage
$200,000
Interest Rate
5.14%
Mortgage Type
New Conventional
Purchase Details
Closed on
Aug 25, 2006
Sold by
Ryland Grp Inc
Bought by
Jones Linda M and Jones Andrew L
Home Financials for this Owner
Home Financials are based on the most recent Mortgage that was taken out on this home.
Original Mortgage
$356,057
Interest Rate
6.73%
Mortgage Type
New Conventional
Create a Home Valuation Report for This Property
The Home Valuation Report is an in-depth analysis detailing your home's value as well as a comparison with similar homes in the area
Home Values in the Area
Average Home Value in this Area
Purchase History
| Date | Buyer | Sale Price | Title Company |
|---|---|---|---|
| Ambaram And Vasumatiben Patel Revocable Trust | -- | None Listed On Document | |
| Ambaram And Vasumatiben Patel Revocable Trust | -- | None Listed On Document | |
| Patel Ambaram U | $260,000 | -- | |
| Jones Linda M | $445,100 | -- |
Source: Public Records
Mortgage History
| Date | Status | Borrower | Loan Amount |
|---|---|---|---|
| Previous Owner | Patel Ambaram U | $200,000 | |
| Previous Owner | Jones Linda M | $356,057 |
Source: Public Records
Tax History Compared to Growth
Tax History
| Year | Tax Paid | Tax Assessment Tax Assessment Total Assessment is a certain percentage of the fair market value that is determined by local assessors to be the total taxable value of land and additions on the property. | Land | Improvement |
|---|---|---|---|---|
| 2025 | $1,937 | $238,368 | $48,000 | $190,368 |
| 2024 | $1,843 | $205,244 | $36,000 | $169,244 |
| 2023 | $1,637 | $205,244 | $36,000 | $169,244 |
| 2022 | $1,843 | $205,244 | $36,000 | $169,244 |
| 2021 | $1,707 | $159,700 | $36,000 | $123,700 |
| 2020 | $1,653 | $151,740 | $32,400 | $119,340 |
| 2019 | $1,653 | $151,740 | $32,400 | $119,340 |
| 2018 | $1,463 | $135,196 | $32,400 | $102,796 |
| 2017 | $1,264 | $135,196 | $32,400 | $102,796 |
| 2016 | $1,334 | $142,200 | $32,400 | $109,800 |
| 2015 | $1,148 | $116,000 | $32,400 | $83,600 |
| 2014 | $1,169 | $116,000 | $0 | $0 |
Source: Public Records
Map
Nearby Homes
- 3837 Thackary Dr
- 2015 Augustine Trace
- 2545 Melville Place
- 1960 Lost Mountain Rd
- Yellowstone Plan at Linden Grove
- Winthrop Plan at Linden Grove
- Valen Plan at Linden Grove
- Tilden Plan at Linden Grove
- Liston Plan at Linden Grove
- Frazier Plan at Linden Grove
- 3598 Velma Dr
- 2445 Hopkins Rd
- 3555 Gus Way
- 3454 Velma Dr
- 3458 Velma Dr
- 2180 Gus Robinson Rd
- 2526 New MacLand Rd
- 1830 Lost Mountain Rd
- 2159 Belmont Trace
- 2124 Chaseford Ln
- 2115 Chaseford Ln
- 3890 Chasemont Dr
- 3900 Chasemont Dr
- 3880 Chasemont Dr
- 3880 Chasemont Dr Unit 3
- 2130 Chaseford Ln
- 2121 Chaseford Ln
- 2127 Chaseford Ln
- 3870 Chasemont Dr
- 2136 Chaseford Ln SW
- 3885 Chasemont Dr SW
- 3905 Chasemont Dr
- 2133 Chaseford Ln
- 3860 Chasemont Dr
- 0 Chasemont Dr SW Unit 8483675
- 0 Chasemont Dr SW Unit 8450434
- 0 Chasemont Dr SW Unit 8950489
- 0 Chasemont Dr SW Unit 8772333
- 0 Chasemont Dr SW Unit 3100227