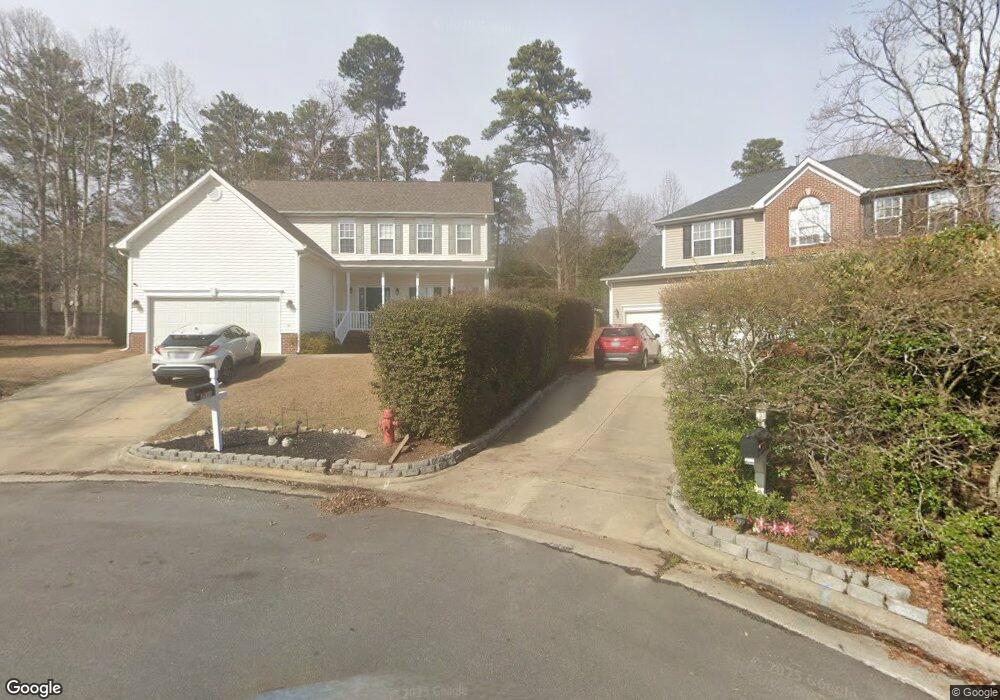
2118 Echo Glen Ln Apex, NC 27523
Beaver Creek NeighborhoodEstimated Value: $620,000 - $684,000
4
Beds
3
Baths
2,463
Sq Ft
$261/Sq Ft
Est. Value
About This Home
This home is located at 2118 Echo Glen Ln, Apex, NC 27523 and is currently estimated at $642,810, approximately $260 per square foot. 2118 Echo Glen Ln is a home located in Wake County with nearby schools including Turner Creek Elementary School, Salem Middle, and Green Level High School.
Ownership History
Date
Name
Owned For
Owner Type
Purchase Details
Closed on
Jan 15, 2016
Sold by
Gessner Steven P and Gessner Paula E
Bought by
Gessner Steven P and Gessner Paula E
Current Estimated Value
Home Financials for this Owner
Home Financials are based on the most recent Mortgage that was taken out on this home.
Original Mortgage
$180,000
Outstanding Balance
$74,228
Interest Rate
3.25%
Mortgage Type
New Conventional
Estimated Equity
$568,582
Purchase Details
Closed on
Apr 13, 2002
Sold by
Gu Pu and Xu Yafei
Bought by
Gessner Seven P and Gessner Paula E
Home Financials for this Owner
Home Financials are based on the most recent Mortgage that was taken out on this home.
Original Mortgage
$157,600
Interest Rate
6.62%
Purchase Details
Closed on
Oct 31, 2000
Sold by
Westminster Homes Of Nc Inc
Bought by
Cu Pu and Xu Yafei
Home Financials for this Owner
Home Financials are based on the most recent Mortgage that was taken out on this home.
Original Mortgage
$155,750
Interest Rate
7.83%
Create a Home Valuation Report for This Property
The Home Valuation Report is an in-depth analysis detailing your home's value as well as a comparison with similar homes in the area
Home Values in the Area
Average Home Value in this Area
Purchase History
| Date | Buyer | Sale Price | Title Company |
|---|---|---|---|
| Gessner Steven P | -- | None Available | |
| Gessner Seven P | $197,000 | -- | |
| Cu Pu | $195,000 | -- |
Source: Public Records
Mortgage History
| Date | Status | Borrower | Loan Amount |
|---|---|---|---|
| Open | Gessner Steven P | $180,000 | |
| Previous Owner | Gessner Seven P | $157,600 | |
| Previous Owner | Cu Pu | $155,750 | |
| Closed | Gessner Seven P | $19,700 |
Source: Public Records
Tax History
| Year | Tax Paid | Tax Assessment Tax Assessment Total Assessment is a certain percentage of the fair market value that is determined by local assessors to be the total taxable value of land and additions on the property. | Land | Improvement |
|---|---|---|---|---|
| 2025 | $5,281 | $602,600 | $225,750 | $376,850 |
| 2024 | $5,163 | $602,600 | $225,750 | $376,850 |
Source: Public Records
Map
Nearby Homes
- 479 Clark Creek Ln
- 1805 Dunwick Ct
- 2300 Walden Creek Dr
- 793 Larkspur Bowl Way
- 7256 Morris Acres Rd
- 2151 Grouse Ski Cir
- 2147 Grouse Ski Cir
- 2145 Grouse Ski Cir
- 7242 Morris Acres Rd
- 831 Tunisian Dr
- 305 Jeter Grove Rd
- 2013 Keokuk Ct
- 2301 Blue Cedar Ct
- 700 Oak Ridge Dr
- 453 Hillman Bend
- 309 Amiable Loop
- 837 Katahdin Way
- 1001 Drayman Place
- 705 Ahad Ct
- 424 Euphoria Cir
- 2116 Echo Glen Ln
- 2117 Echo Glen Ln
- 2114 Echo Glen Ln
- 2115 Echo Glen Ln
- 2111 Oak Stream Ln
- 2112 Echo Glen Ln
- 2113 Echo Glen Ln
- 2113 Oak Stream Ln
- 2703 Colony Woods Dr
- 7200 Jenks Rd
- 2109 Oak Stream Ln
- 2111 Echo Glen Ln
- 2701 Colony Woods Dr
- 2108 Echo Glen Ln
- 721 Old Kestrel Dr
- 2116 Oak Stream Ln
- 2607 Colony Woods Dr
- 2107 Oak Stream Ln
- 2109 Echo Glen Ln
- 2106 Echo Glen Ln
Your Personal Tour Guide
Ask me questions while you tour the home.