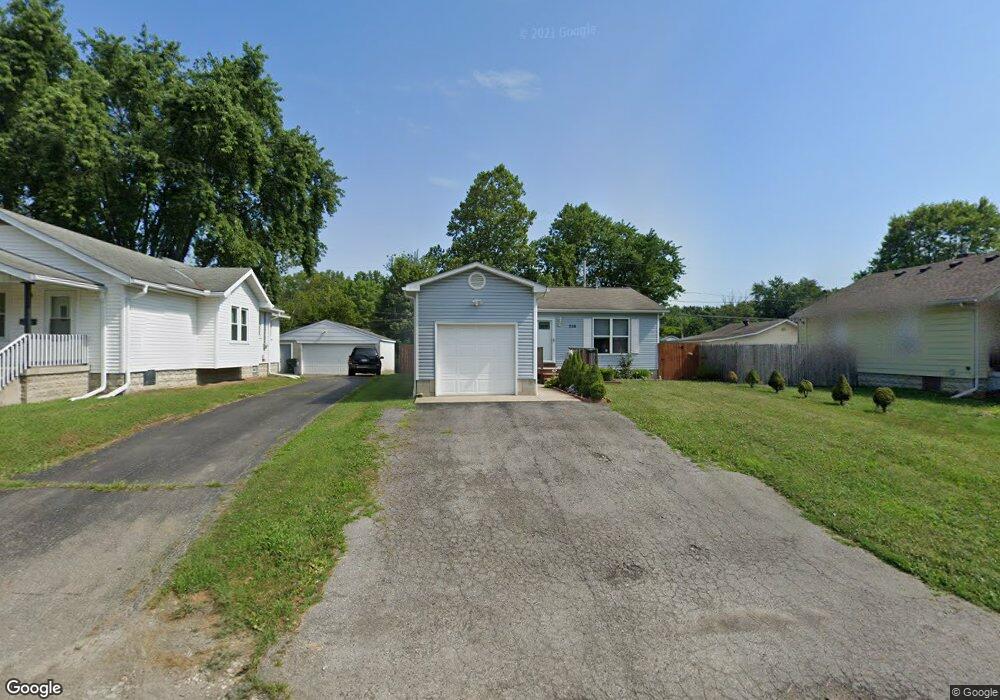
2118 Ferris Rd Columbus, OH 43224
North Linden NeighborhoodEstimated Value: $175,000 - $199,000
3
Beds
1
Bath
1,044
Sq Ft
$178/Sq Ft
Est. Value
About This Home
This home is located at 2118 Ferris Rd, Columbus, OH 43224 and is currently estimated at $185,484, approximately $177 per square foot. 2118 Ferris Rd is a home located in Franklin County with nearby schools including North Linden Elementary School, Medina Middle School, and Mifflin High School.
Ownership History
Date
Name
Owned For
Owner Type
Purchase Details
Closed on
Aug 11, 2011
Sold by
Secretary Of Housing & Urban Development
Bought by
Gutierrez Maria
Current Estimated Value
Purchase Details
Closed on
Mar 23, 2011
Sold by
Estep Shannon
Bought by
Citimortgage Inc
Purchase Details
Closed on
Mar 16, 2011
Sold by
Citimortgage Inc
Bought by
Secretary Of Housing & Urban Development
Purchase Details
Closed on
Sep 22, 2000
Sold by
Schybal Joseph and Schybal Beverly
Bought by
Estep Shannon
Purchase Details
Closed on
May 6, 1994
Create a Home Valuation Report for This Property
The Home Valuation Report is an in-depth analysis detailing your home's value as well as a comparison with similar homes in the area
Home Values in the Area
Average Home Value in this Area
Purchase History
We collect this data history from publicly available records. To have your information removed, we recommend requesting removal directly through your county’s website.
| Date | Buyer | Sale Price | Title Company |
|---|---|---|---|
| Gutierrez Maria | $36,960 | Lakeside Ti | |
| Citimortgage Inc | $89,219 | Allodial | |
| Secretary Of Housing & Urban Development | -- | None Available | |
| Estep Shannon | $84,200 | Chicago Title West | |
| -- | -- | -- |
Source: Public Records
Tax History
| Year | Tax Paid | Tax Assessment Tax Assessment Total Assessment is a certain percentage of the fair market value that is determined by local assessors to be the total taxable value of land and additions on the property. | Land | Improvement |
|---|---|---|---|---|
| 2025 | $2,879 | $49,850 | $9,000 | $40,850 |
| 2024 | $2,879 | $49,850 | $9,000 | $40,850 |
| 2023 | $2,848 | $49,840 | $8,995 | $40,845 |
| 2022 | $2,057 | $28,250 | $5,500 | $22,750 |
| 2021 | $2,060 | $28,250 | $5,500 | $22,750 |
| 2020 | $2,063 | $28,250 | $5,500 | $22,750 |
| 2019 | $1,767 | $22,400 | $4,410 | $17,990 |
| 2018 | $1,956 | $22,400 | $4,410 | $17,990 |
| 2017 | $2,113 | $22,400 | $4,410 | $17,990 |
| 2016 | $2,460 | $28,210 | $3,570 | $24,640 |
| 2015 | $2,146 | $28,210 | $3,570 | $24,640 |
| 2014 | $2,150 | $28,210 | $3,570 | $24,640 |
| 2013 | $1,172 | $31,325 | $3,955 | $27,370 |
Source: Public Records
Map
Nearby Homes
Your Personal Tour Guide
Ask me questions while you tour the home.