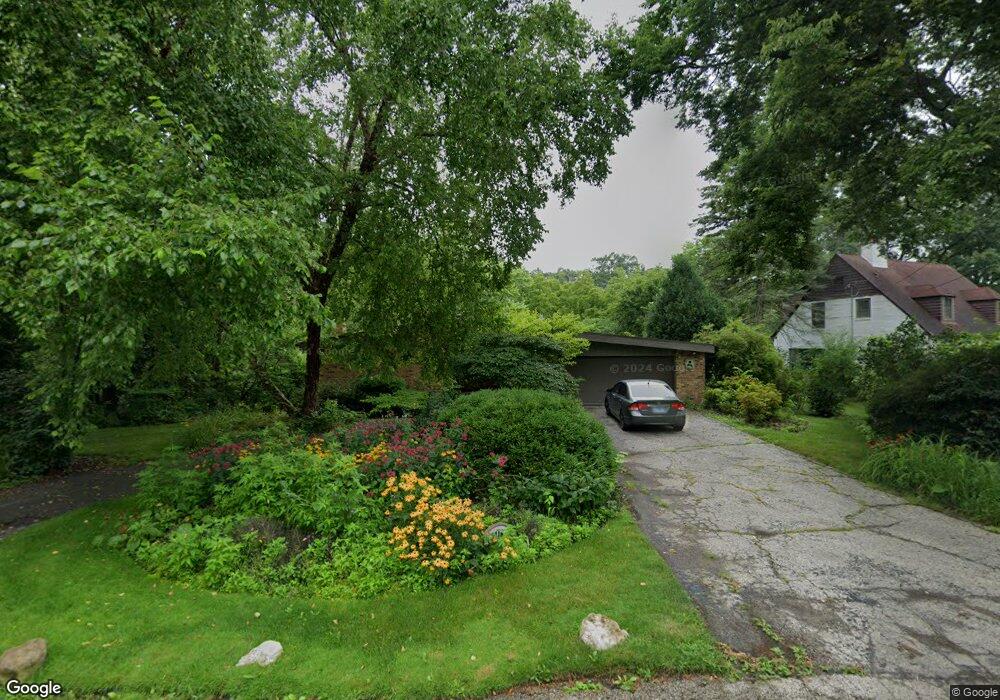
2118 Miraflores Ave Waukegan, IL 60087
Estimated Value: $420,000 - $448,425
3
Beds
5
Baths
2,904
Sq Ft
$150/Sq Ft
Est. Value
About This Home
This home is located at 2118 Miraflores Ave, Waukegan, IL 60087 and is currently estimated at $436,606, approximately $150 per square foot. 2118 Miraflores Ave is a home located in Lake County with nearby schools including Greenwood Elementary School, Edith M Smith Middle School, and Waukegan High School.
Ownership History
Date
Name
Owned For
Owner Type
Purchase Details
Closed on
Apr 15, 2005
Sold by
Declara Sharifi Maryann W and Declara Maryann W Sharifi 1992
Bought by
Abt Perkins Dawn
Current Estimated Value
Home Financials for this Owner
Home Financials are based on the most recent Mortgage that was taken out on this home.
Original Mortgage
$280,000
Interest Rate
6.06%
Mortgage Type
Balloon
Purchase Details
Closed on
Sep 20, 2001
Sold by
Sharifi Manoochehr and Sharifi Maryann
Bought by
Declara Sharifi Maryann W and Declara Maryann W Sharifi 1992
Create a Home Valuation Report for This Property
The Home Valuation Report is an in-depth analysis detailing your home's value as well as a comparison with similar homes in the area
Home Values in the Area
Average Home Value in this Area
Purchase History
| Date | Buyer | Sale Price | Title Company |
|---|---|---|---|
| Abt Perkins Dawn | $350,000 | -- | |
| Declara Sharifi Maryann W | -- | -- |
Source: Public Records
Mortgage History
| Date | Status | Borrower | Loan Amount |
|---|---|---|---|
| Closed | Abt Perkins Dawn | $280,000 |
Source: Public Records
Tax History Compared to Growth
Tax History
| Year | Tax Paid | Tax Assessment Tax Assessment Total Assessment is a certain percentage of the fair market value that is determined by local assessors to be the total taxable value of land and additions on the property. | Land | Improvement |
|---|---|---|---|---|
| 2024 | $10,706 | $134,743 | $14,977 | $119,766 |
| 2023 | $10,486 | $121,542 | $13,509 | $108,033 |
| 2022 | $10,486 | $113,263 | $20,224 | $93,039 |
| 2021 | $8,832 | $90,716 | $16,028 | $74,688 |
| 2020 | $8,900 | $84,513 | $14,932 | $69,581 |
| 2019 | $8,904 | $77,443 | $13,683 | $63,760 |
| 2018 | $9,186 | $77,430 | $22,131 | $55,299 |
| 2017 | $8,891 | $68,504 | $19,580 | $48,924 |
| 2016 | $8,272 | $59,527 | $17,014 | $42,513 |
| 2015 | $7,986 | $53,278 | $15,228 | $38,050 |
| 2014 | $7,919 | $52,343 | $10,543 | $41,800 |
| 2012 | $9,634 | $56,709 | $11,423 | $45,286 |
Source: Public Records
Map
Nearby Homes
- 2213 Alta Vista Dr
- 2246 Alta Vista Dr
- 0 Traditions Dr
- 301 W Eagle Ct
- 616 W Keith Ave
- 2232 Walnut St
- 1905 Linden Ave
- 37231 N Ganster Rd
- 1018 W Atlantic Ave
- 1336 N Ash St
- 1335 Chestnut St
- 1110 N Ash St
- 1312 N Linden Ave
- 415 W Ridgeland Ave
- 10241 W Bairstow Ave
- 1105 Woodlawn Cir
- 918 N Ash St
- 1612 Whitney St
- 1504 W Glen Flora Ave
- 2350 N Lewis Ave
- 2122 Miraflores Ave
- 2125 Miraflores Ave
- 116 Spruce Ave
- 2110 Miraflores Ave
- 117 Willow Dr
- 112 Spruce Ave
- 2060 Miraflores Ave
- 2126 Miraflores Ave
- 115 Willow Dr
- 110 Spruce Ave
- 111 Willow Dr
- 106 Spruce Ave
- 2054 Miraflores Ave
- 2055 Miraflores Ave
- 103 Willow Dr
- 102 Spruce Ave
- 108 Willow Dr
- 2050 Miraflores Ave
- 111 Spruce Ave
- 127 Miraflores Ave