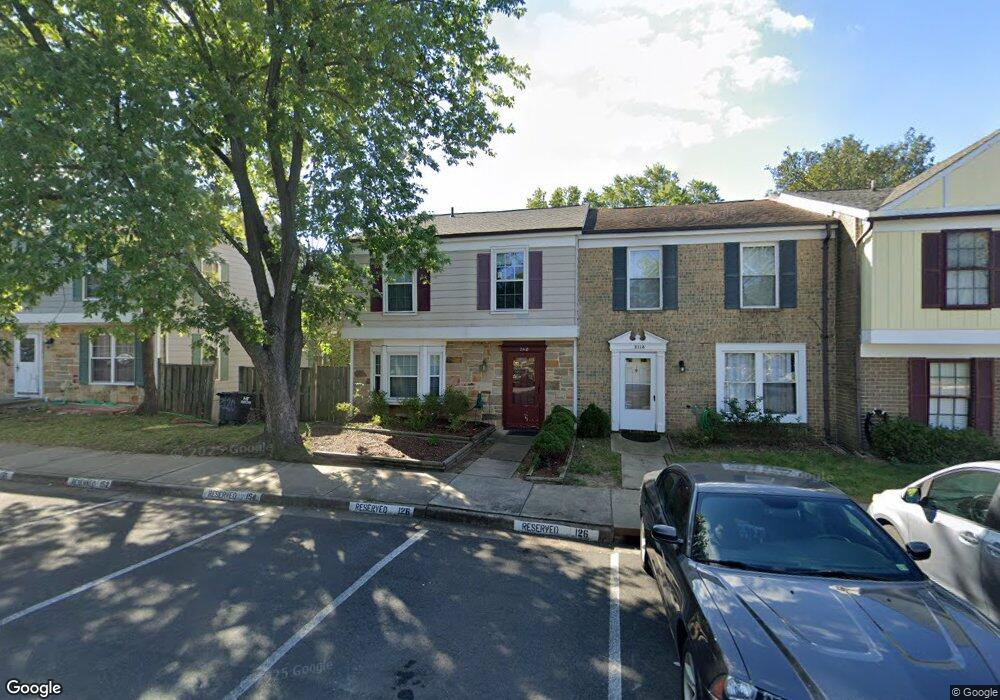
2118 Monaghan Dr Herndon, VA 20170
Estimated Value: $432,000 - $473,000
4
Beds
3
Baths
1,496
Sq Ft
$306/Sq Ft
Est. Value
About This Home
This home is located at 2118 Monaghan Dr, Herndon, VA 20170 and is currently estimated at $458,259, approximately $306 per square foot. 2118 Monaghan Dr is a home located in Fairfax County with nearby schools including Hutchison Elementary, Herndon Middle School, and Herndon High School.
Ownership History
Date
Name
Owned For
Owner Type
Purchase Details
Closed on
Sep 15, 2025
Sold by
Kabir Mohammad Lutful
Bought by
Kabir Mohammad Lutful and Begum Julika
Current Estimated Value
Purchase Details
Closed on
Nov 12, 2024
Sold by
Aziz Nighat
Bought by
Kabir Mohammad Lutful
Home Financials for this Owner
Home Financials are based on the most recent Mortgage that was taken out on this home.
Original Mortgage
$245,100
Interest Rate
6.12%
Mortgage Type
New Conventional
Purchase Details
Closed on
Jan 8, 2001
Sold by
Baten Taseem M
Bought by
Aziz Nighat
Home Financials for this Owner
Home Financials are based on the most recent Mortgage that was taken out on this home.
Original Mortgage
$124,200
Interest Rate
7.69%
Purchase Details
Closed on
Jun 30, 2000
Sold by
Langolis John
Bought by
Om Vy
Home Financials for this Owner
Home Financials are based on the most recent Mortgage that was taken out on this home.
Original Mortgage
$118,916
Interest Rate
8.59%
Create a Home Valuation Report for This Property
The Home Valuation Report is an in-depth analysis detailing your home's value as well as a comparison with similar homes in the area
Home Values in the Area
Average Home Value in this Area
Purchase History
| Date | Buyer | Sale Price | Title Company |
|---|---|---|---|
| Kabir Mohammad Lutful | -- | None Listed On Document | |
| Kabir Mohammad Lutful | $456,000 | Central Title | |
| Kabir Mohammad Lutful | $456,000 | Central Title | |
| Kabir Mohammad Lutful | $456,000 | Central Title | |
| Aziz Nighat | $138,000 | -- | |
| Om Vy | $118,900 | -- |
Source: Public Records
Mortgage History
| Date | Status | Borrower | Loan Amount |
|---|---|---|---|
| Previous Owner | Kabir Mohammad Lutful | $245,100 | |
| Previous Owner | Aziz Nighat | $124,200 | |
| Previous Owner | Om Vy | $118,916 |
Source: Public Records
Tax History
| Year | Tax Paid | Tax Assessment Tax Assessment Total Assessment is a certain percentage of the fair market value that is determined by local assessors to be the total taxable value of land and additions on the property. | Land | Improvement |
|---|---|---|---|---|
| 2025 | $4,591 | $434,730 | $130,000 | $304,730 |
| 2024 | $4,591 | $396,330 | $125,000 | $271,330 |
| 2023 | $4,239 | $375,660 | $120,000 | $255,660 |
| 2022 | $3,924 | $343,170 | $105,000 | $238,170 |
| 2021 | $3,995 | $340,470 | $105,000 | $235,470 |
| 2020 | $3,807 | $321,650 | $105,000 | $216,650 |
| 2019 | $3,503 | $295,970 | $105,000 | $190,970 |
| 2018 | $3,335 | $290,040 | $102,000 | $188,040 |
| 2017 | $3,367 | $290,040 | $102,000 | $188,040 |
| 2016 | $3,179 | $274,400 | $97,000 | $177,400 |
Source: Public Records
Map
Nearby Homes
- 2108 Mager Dr
- 1227 Springtide Place
- 13280 Poener Place
- 2214 Jensen Place
- 13400 Catoctin Ct
- 13209 Keach Place
- 2201 Gingell Place
- 2135 Glacier Rd Unit 90
- 2205 Herman Ct
- 13315 Aiken Place
- 1057 Lexus Way
- 1219 Alabama Dr
- 2152 Rock Hill Rd
- 2320 Field Point Rd Unit 4-304
- 2324 Wind Charm St Unit 306
- 13621 Dulles Technology Dr Unit 151
- 805 Mosby Hollow Dr
- 412 Patrick Ln
- 13334 Arrowbrook Centre Dr Unit 112
- 13342 Arrowbrook Centre Dr Unit 108
- 2116 Monaghan Dr
- 2120 Monaghan Dr
- 2114 Monaghan Dr
- 2122 Monaghan Dr
- 2112 Monaghan Dr
- 2124 Monaghan Dr
- 2110 Monaghan Dr
- 2126 Monaghan Dr
- 2108 Monaghan Dr
- 2128 Monaghan Dr
- 2106 Monaghan Dr
- 2130 Monaghan Dr
- 2104 Monaghan Dr
- 2132 Monaghan Dr
- 2135 Monaghan Dr
- 2133 Monaghan Dr
- 2131 Monaghan Dr
- 2102 Monaghan Dr
- 2129 Monaghan Dr
- 2134 Monaghan Dr
Your Personal Tour Guide
Ask me questions while you tour the home.