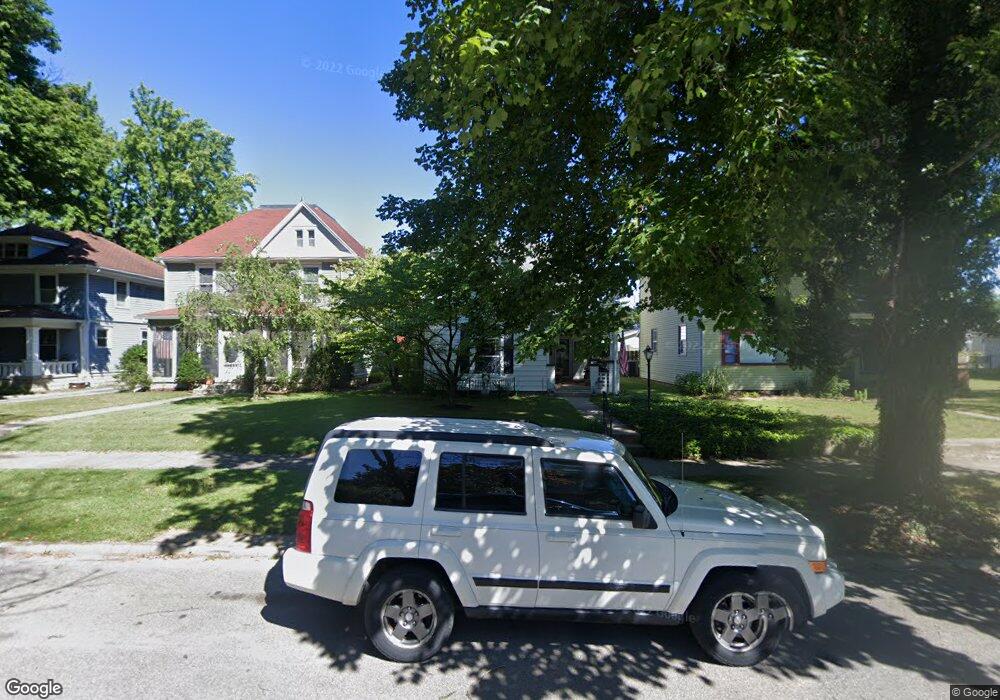
2118 North St Logansport, IN 46947
Estimated Value: $127,000 - $165,000
3
Beds
1
Bath
2,244
Sq Ft
$67/Sq Ft
Est. Value
About This Home
This home is located at 2118 North St, Logansport, IN 46947 and is currently estimated at $150,460, approximately $67 per square foot. 2118 North St is a home located in Cass County with nearby schools including Logansport Community High School and All Saints Catholic School.
Ownership History
Date
Name
Owned For
Owner Type
Purchase Details
Closed on
May 11, 2023
Sold by
Raderstorf Bradley A
Bought by
Wicker Pamela D
Current Estimated Value
Purchase Details
Closed on
Nov 18, 2021
Sold by
Wicker Pamela D
Bought by
Wicker Pamela D and Raderstorf Bradley A
Home Financials for this Owner
Home Financials are based on the most recent Mortgage that was taken out on this home.
Original Mortgage
$53,000
Interest Rate
2.23%
Mortgage Type
New Conventional
Create a Home Valuation Report for This Property
The Home Valuation Report is an in-depth analysis detailing your home's value as well as a comparison with similar homes in the area
Home Values in the Area
Average Home Value in this Area
Purchase History
| Date | Buyer | Sale Price | Title Company |
|---|---|---|---|
| Wicker Pamela D | -- | None Listed On Document | |
| Wicker Pamela D | $70,490 | None Listed On Document |
Source: Public Records
Mortgage History
| Date | Status | Borrower | Loan Amount |
|---|---|---|---|
| Previous Owner | Wicker Pamela D | $53,000 |
Source: Public Records
Tax History Compared to Growth
Tax History
| Year | Tax Paid | Tax Assessment Tax Assessment Total Assessment is a certain percentage of the fair market value that is determined by local assessors to be the total taxable value of land and additions on the property. | Land | Improvement |
|---|---|---|---|---|
| 2024 | $973 | $95,500 | $9,700 | $85,800 |
| 2022 | $804 | $81,500 | $9,700 | $71,800 |
| 2021 | $737 | $74,600 | $9,100 | $65,500 |
| 2020 | $662 | $69,400 | $9,100 | $60,300 |
| 2019 | $638 | $64,700 | $9,100 | $55,600 |
| 2018 | $676 | $69,100 | $9,100 | $60,000 |
| 2017 | $678 | $67,600 | $8,200 | $59,400 |
| 2016 | $559 | $61,800 | $8,200 | $53,600 |
| 2014 | $500 | $55,800 | $8,200 | $47,600 |
| 2013 | $500 | $54,700 | $8,200 | $46,500 |
Source: Public Records
Map
Nearby Homes