A
Seller's Agent in 2022
Amanda Wiley & K Team
Era All In One Realty
(229) 888-6670
57 in this area
2,617 Total Sales
Estimated Value: $193,000 - $209,077
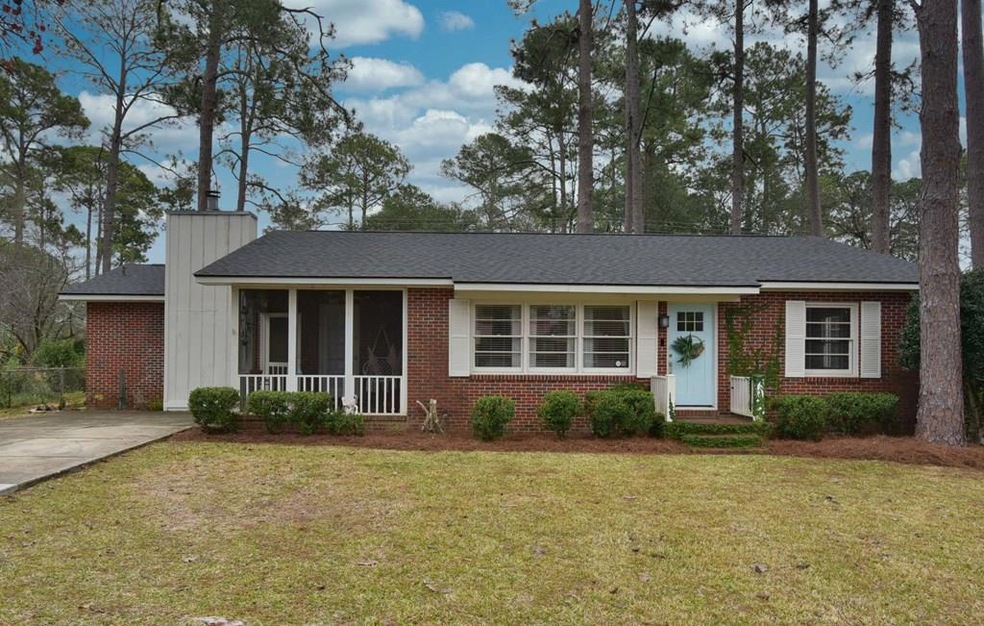
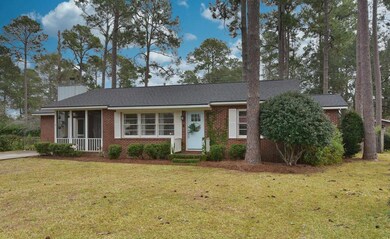
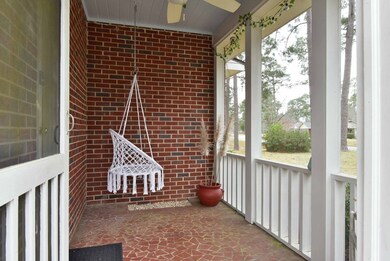
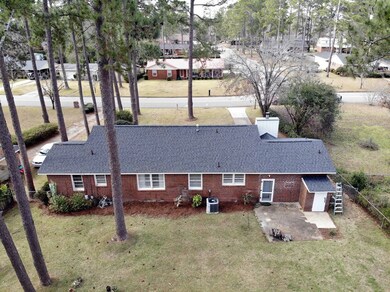
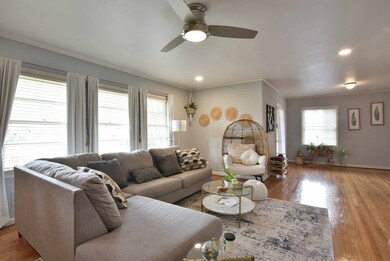
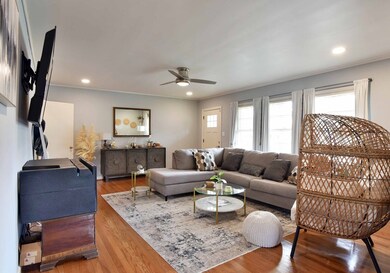
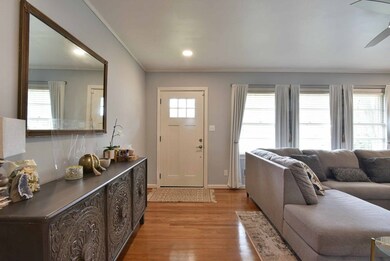
~ LOVELY IN LAKE PARK ~ UPDATED ~ FENCED BACK YARD ~ ALL BRICK ~ Pristine, Sparkling, and Move-in Ready in Lake Park School district! This home features three bedrooms, two bath home with approximately 1,801 square feet of light and bright space. Walk in the front door and you will be in awe of the real hardwood flooring in the living room and dining room combo along with large windows for tons of natural light. The kitchen and breakfast nook have been updated with stainless appliances, updated counter tops, fresh paint, painted cabinets and hardwood floors. The bonus room/den space has a wood burning fireplace, full bathroom, built-in cabinets, and laundry room. Three bedrooms with hardwood floors are privately located on the other side of the house and are large enough to accommodate kings, queens, and twin beds and have ample closet space! The Main Hall Bathroom has been updated with new mirrors, double sinks, countertops, tile floors and new lighting! Outside you will enjoy the front screen porch and beautiful views of front yard. The back yard is fenced and has an open patio with alley access. Other features of this home include: chair rail and crown molding, plantation blinds, alarm system, freshly painted throughout, recessed lightning, super laundry room, new roof only 3 years old! Excellent location close to everything!
Last Agent to Sell the Property
Era All In One Realty Brokerage Phone: 2298886670 License #309999 Listed on: 01/29/2022
| Date | Buyer | Sale Price | Title Company |
|---|---|---|---|
| Watts Tammy | $169,900 | -- | |
| Hall Clayton Cecil | $134,500 | -- | |
| Haynes Paul Jason | -- | -- | |
| Haynes Paul Jason | $121,500 | -- | |
| Knox Winifred M | -- | -- | |
| Knox Winifred Moore As Trustee Of The | -- | -- | |
| Knox Winifred M | -- | -- | |
| Knox J E | -- | -- |
| Date | Status | Borrower | Loan Amount |
|---|---|---|---|
| Previous Owner | Hall Clayton Cecil | $132,063 | |
| Previous Owner | Knox Winifred M | $115,425 |
| Date | Event | Price | List to Sale | Price per Sq Ft | Prior Sale |
|---|---|---|---|---|---|
| 02/28/2022 02/28/22 | Sold | $169,900 | +26.3% | $94 / Sq Ft | |
| 01/29/2022 01/29/22 | Pending | -- | -- | -- | |
| 02/26/2021 02/26/21 | Sold | $134,500 | +10.7% | $75 / Sq Ft | View Prior Sale |
| 01/13/2021 01/13/21 | Pending | -- | -- | -- | |
| 09/20/2019 09/20/19 | Sold | $121,500 | -- | $67 / Sq Ft | View Prior Sale |
| 08/15/2019 08/15/19 | Pending | -- | -- | -- |
| Year | Tax Paid | Tax Assessment Tax Assessment Total Assessment is a certain percentage of the fair market value that is determined by local assessors to be the total taxable value of land and additions on the property. | Land | Improvement |
|---|---|---|---|---|
| 2024 | $2,124 | $46,520 | $7,760 | $38,760 |
| 2023 | $2,167 | $46,520 | $7,760 | $38,760 |
| 2022 | $1,899 | $40,600 | $7,760 | $32,840 |
| 2021 | $1,760 | $40,600 | $7,760 | $32,840 |
| 2020 | $1,764 | $40,600 | $7,760 | $32,840 |
| 2019 | $1,771 | $40,600 | $7,760 | $32,840 |
| 2018 | $1,493 | $40,600 | $7,760 | $32,840 |
| 2017 | $1,383 | $40,600 | $7,760 | $32,840 |
| 2016 | $1,384 | $40,600 | $7,760 | $32,840 |
| 2015 | $1,386 | $40,600 | $7,760 | $32,840 |
| 2014 | $1,444 | $42,560 | $9,720 | $32,840 |
A
Seller's Agent in 2022
Amanda Wiley & K Team
Era All In One Realty
(229) 888-6670
57 in this area
2,617 Total Sales
A
Buyer's Agent in 2022
Anneke Simmons
A+g Simmons Realty, LLC
(229) 395-7618
4 in this area
25 Total Sales

Seller's Agent in 2021
KATIE HUGHEY GATEWOOD
Hughey & Neuman, Inc.
(229) 881-0743
23 in this area
249 Total Sales
Seller's Agent in 2019
Callie Hughey-Walker
Hughey & Neuman, Inc.
(229) 344-5261
18 in this area
279 Total Sales
Source: Albany Board of REALTORS®
MLS Number: 149434
APN: 0000P-00005-009