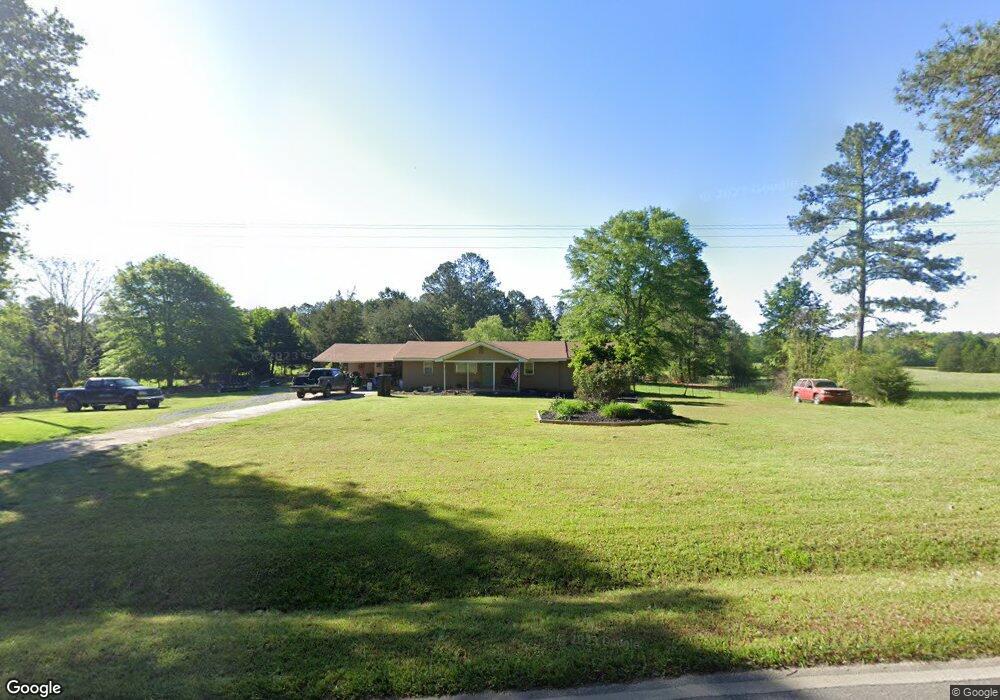
2118 Rocky Bottom Rd the Rock, GA 30285
Estimated Value: $179,000 - $328,000
3
Beds
1
Bath
1,498
Sq Ft
$156/Sq Ft
Est. Value
About This Home
This home is located at 2118 Rocky Bottom Rd, the Rock, GA 30285 and is currently estimated at $234,125, approximately $156 per square foot. 2118 Rocky Bottom Rd is a home located in Upson County with nearby schools including Upson-Lee South Elementary School, Upson-Lee North Elementary School, and Upson-Lee Middle School.
Ownership History
Date
Name
Owned For
Owner Type
Purchase Details
Closed on
Feb 21, 2022
Sold by
Stephens Michael W
Bought by
Stephens Michael W and Stephens Karen Bates
Current Estimated Value
Home Financials for this Owner
Home Financials are based on the most recent Mortgage that was taken out on this home.
Original Mortgage
$104,000
Outstanding Balance
$96,734
Interest Rate
3.69%
Mortgage Type
FHA
Estimated Equity
$137,391
Purchase Details
Closed on
Aug 8, 2014
Sold by
Brooks Benjamin E
Bought by
Stephens Michael
Home Financials for this Owner
Home Financials are based on the most recent Mortgage that was taken out on this home.
Original Mortgage
$75,510
Interest Rate
4.19%
Mortgage Type
New Conventional
Purchase Details
Closed on
Nov 13, 2006
Sold by
Sec Of Veternas Affa
Bought by
Brooks Benjamin E
Home Financials for this Owner
Home Financials are based on the most recent Mortgage that was taken out on this home.
Original Mortgage
$72,183
Interest Rate
6.31%
Mortgage Type
New Conventional
Create a Home Valuation Report for This Property
The Home Valuation Report is an in-depth analysis detailing your home's value as well as a comparison with similar homes in the area
Home Values in the Area
Average Home Value in this Area
Purchase History
| Date | Buyer | Sale Price | Title Company |
|---|---|---|---|
| Stephens Michael W | -- | -- | |
| Stephens Michael | $74,000 | -- | |
| Brooks Benjamin E | -- | -- |
Source: Public Records
Mortgage History
| Date | Status | Borrower | Loan Amount |
|---|---|---|---|
| Open | Stephens Michael W | $104,000 | |
| Previous Owner | Stephens Michael | $75,510 | |
| Previous Owner | Brooks Benjamin E | $72,183 |
Source: Public Records
Tax History Compared to Growth
Tax History
| Year | Tax Paid | Tax Assessment Tax Assessment Total Assessment is a certain percentage of the fair market value that is determined by local assessors to be the total taxable value of land and additions on the property. | Land | Improvement |
|---|---|---|---|---|
| 2024 | $1,569 | $58,198 | $8,342 | $49,856 |
| 2023 | $1,528 | $56,515 | $8,342 | $48,173 |
| 2022 | $1,109 | $39,994 | $4,106 | $35,888 |
| 2021 | $859 | $32,602 | $4,106 | $28,496 |
| 2020 | $873 | $30,943 | $3,609 | $27,334 |
| 2019 | $894 | $29,174 | $3,609 | $25,565 |
| 2018 | $894 | $29,174 | $3,609 | $25,565 |
| 2017 | $807 | $23,990 | $3,609 | $20,381 |
| 2016 | $780 | $22,808 | $3,008 | $19,800 |
| 2015 | $780 | $22,808 | $3,008 | $19,800 |
| 2014 | $843 | $24,628 | $4,385 | $20,244 |
Source: Public Records
Map
Nearby Homes
- 1907 Rocky Bottom Rd
- 98 Mud Bridge Rd
- 28 Mud Bridge Rd
- 0 Alabama Rd Unit 22813063
- Race Track Rd
- 0 Barnesville Hwy Unit 10548523
- 1757 Alabama Rd
- 297 Bishop Rd
- 561 Jugtown Rd
- 63 Alabama Rd
- 0 Stewart Rd
- 0 Technology Pkwy Unit 30119
- 0 Technology Pkwy Unit 21917
- 0 Technology Pkwy Unit 30117
- 781 N Delray Rd
- 206 Shannon Ct
- 0 Tyler Ln
- 3682 Barnesville Hwy
- 307 Pardue Dr
- 61 ACRES Barnesville Hwy
- 2166 Rocky Bottom Rd
- 2183 Rocky Bottom Rd
- 2088 Rocky Bottom Rd
- 2045 Rocky Bottom Rd
- 2040 Rocky Bottom Rd
- 2112 Rocky Bottom Rd
- 2020 Rocky Bottom Rd
- 1083 Mud Bridge Rd
- 1975 Rocky Bottom Rd
- 1961 Rocky Bottom Rd
- 2031 Rocky Bottom Rd
- 1231 Mud Bridge Rd
- 42 Rose Creek Rd
- 2354 Rocky Bottom Rd
- 100 Potato Creek Rd
- 1795 Rocky Bottom Rd
- 82 Rose Creek Rd
- 137 Potato Creek Rd
- 95 Rose Creek Rd
- 0 Potato Creek Rd Unit 10350303