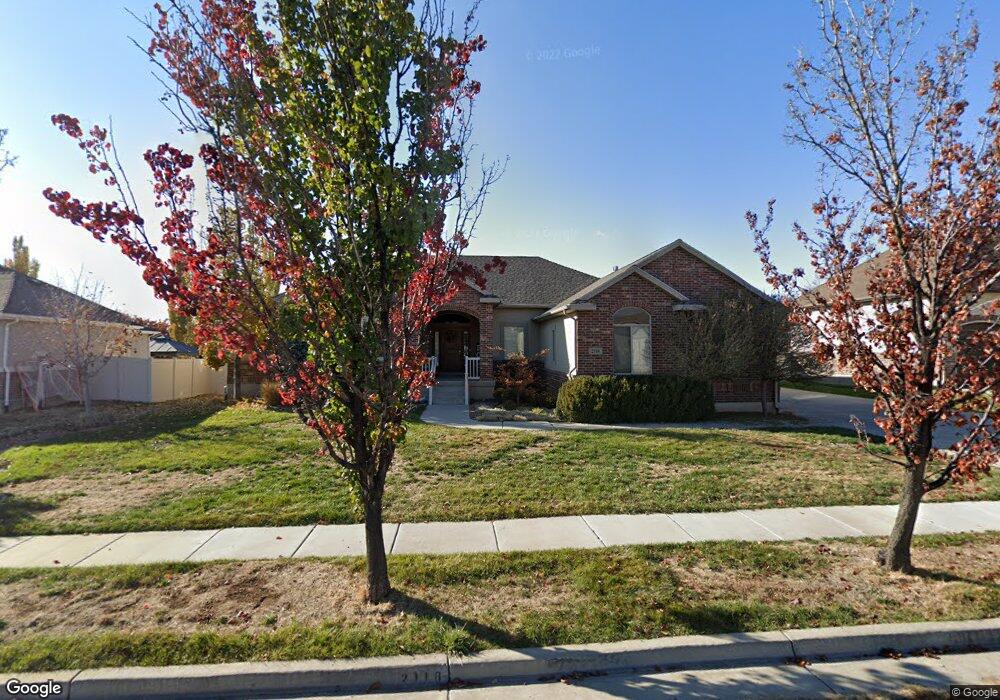
2118 S 700 W Syracuse, UT 84075
Estimated Value: $737,000 - $818,475
6
Beds
4
Baths
4,259
Sq Ft
$183/Sq Ft
Est. Value
About This Home
This home is located at 2118 S 700 W, Syracuse, UT 84075 and is currently estimated at $777,369, approximately $182 per square foot. 2118 S 700 W is a home located in Davis County with nearby schools including Bluff Ridge Elementary, Legacy Junior High School, and Clearfield High School.
Ownership History
Date
Name
Owned For
Owner Type
Purchase Details
Closed on
Feb 27, 2007
Sold by
Walter Kipling W
Bought by
Fowler Christian
Current Estimated Value
Home Financials for this Owner
Home Financials are based on the most recent Mortgage that was taken out on this home.
Original Mortgage
$310,500
Outstanding Balance
$186,493
Interest Rate
6.21%
Mortgage Type
Purchase Money Mortgage
Estimated Equity
$590,877
Purchase Details
Closed on
Aug 12, 2005
Sold by
Waynell Investment Co Llc
Bought by
Walter Kipling W
Home Financials for this Owner
Home Financials are based on the most recent Mortgage that was taken out on this home.
Original Mortgage
$257,355
Interest Rate
6.25%
Mortgage Type
Fannie Mae Freddie Mac
Create a Home Valuation Report for This Property
The Home Valuation Report is an in-depth analysis detailing your home's value as well as a comparison with similar homes in the area
Home Values in the Area
Average Home Value in this Area
Purchase History
| Date | Buyer | Sale Price | Title Company |
|---|---|---|---|
| Fowler Christian | -- | First American Title | |
| Walter Kipling W | -- | Bonneville Title Company |
Source: Public Records
Mortgage History
| Date | Status | Borrower | Loan Amount |
|---|---|---|---|
| Open | Fowler Christian | $310,500 | |
| Previous Owner | Walter Kipling W | $257,355 |
Source: Public Records
Tax History Compared to Growth
Tax History
| Year | Tax Paid | Tax Assessment Tax Assessment Total Assessment is a certain percentage of the fair market value that is determined by local assessors to be the total taxable value of land and additions on the property. | Land | Improvement |
|---|---|---|---|---|
| 2025 | $4,544 | $438,350 | $127,953 | $310,397 |
| 2024 | $4,269 | $414,700 | $108,737 | $305,963 |
| 2023 | $4,012 | $710,000 | $151,343 | $558,657 |
| 2022 | $4,251 | $412,500 | $86,715 | $325,785 |
| 2021 | $3,662 | $550,000 | $128,479 | $421,521 |
| 2020 | $3,431 | $499,000 | $110,452 | $388,548 |
| 2019 | $3,413 | $490,000 | $109,759 | $380,241 |
| 2018 | $3,193 | $455,000 | $105,034 | $349,966 |
| 2016 | $2,904 | $216,975 | $40,248 | $176,727 |
| 2015 | $2,845 | $202,455 | $40,248 | $162,207 |
| 2014 | $2,918 | $211,632 | $40,248 | $171,384 |
| 2013 | -- | $180,196 | $38,213 | $141,983 |
Source: Public Records
Map
Nearby Homes