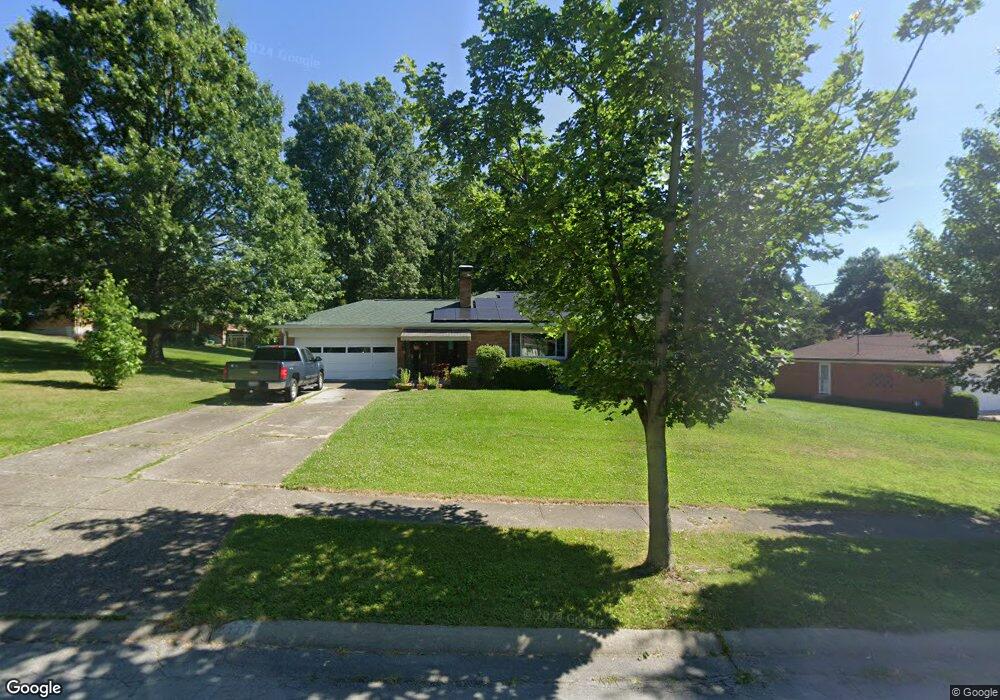
2118 Simbury Ct Cincinnati, OH 45224
College Hill NeighborhoodEstimated Value: $245,000 - $307,000
2
Beds
3
Baths
1,324
Sq Ft
$206/Sq Ft
Est. Value
About This Home
This home is located at 2118 Simbury Ct, Cincinnati, OH 45224 and is currently estimated at $272,819, approximately $206 per square foot. 2118 Simbury Ct is a home located in Hamilton County with nearby schools including Mt. Airy Elementary School, Western Hills High School, and Gilbert A. Dater High School.
Ownership History
Date
Name
Owned For
Owner Type
Purchase Details
Closed on
Dec 9, 2021
Sold by
Morgan Terry D and Morgan Bernice A
Bought by
Morgan Bernice A
Current Estimated Value
Purchase Details
Closed on
Jul 20, 2021
Sold by
Chester John W
Bought by
Chester John W and The John W Chester Revocable T
Purchase Details
Closed on
Dec 6, 2001
Sold by
Feeney Anna Mary
Bought by
Chester John W
Home Financials for this Owner
Home Financials are based on the most recent Mortgage that was taken out on this home.
Original Mortgage
$88,000
Outstanding Balance
$32,762
Interest Rate
6.52%
Estimated Equity
$240,057
Create a Home Valuation Report for This Property
The Home Valuation Report is an in-depth analysis detailing your home's value as well as a comparison with similar homes in the area
Home Values in the Area
Average Home Value in this Area
Purchase History
| Date | Buyer | Sale Price | Title Company |
|---|---|---|---|
| Morgan Bernice A | -- | None Available | |
| Chester John W | -- | None Available | |
| Chester John W | $110,000 | -- |
Source: Public Records
Mortgage History
| Date | Status | Borrower | Loan Amount |
|---|---|---|---|
| Open | Chester John W | $88,000 |
Source: Public Records
Tax History
| Year | Tax Paid | Tax Assessment Tax Assessment Total Assessment is a certain percentage of the fair market value that is determined by local assessors to be the total taxable value of land and additions on the property. | Land | Improvement |
|---|---|---|---|---|
| 2025 | $4,463 | $72,024 | $18,645 | $53,379 |
| 2024 | $4,328 | $72,024 | $18,645 | $53,379 |
| 2023 | $4,425 | $72,024 | $18,645 | $53,379 |
| 2022 | $3,265 | $47,523 | $15,183 | $32,340 |
| 2021 | $3,133 | $47,523 | $15,183 | $32,340 |
| 2020 | $3,225 | $47,523 | $15,183 | $32,340 |
| 2019 | $3,094 | $41,686 | $13,318 | $28,368 |
| 2018 | $3,099 | $41,686 | $13,318 | $28,368 |
| 2017 | $2,943 | $41,686 | $13,318 | $28,368 |
| 2016 | $2,814 | $39,285 | $14,207 | $25,078 |
| 2015 | $2,538 | $39,285 | $14,207 | $25,078 |
| 2014 | $2,556 | $39,285 | $14,207 | $25,078 |
| 2013 | $2,679 | $40,503 | $14,648 | $25,855 |
Source: Public Records
Map
Nearby Homes
- 2235 W North Bend Rd
- 5801 Blue Spruce Ln
- 1961 Connecticut Ave
- 1963 W North Bend Rd
- 6078 Oakwood Ave
- 1831 W North Bend Rd
- 6254 Betts Ave
- 5751 Belmont Ave
- 2125 Mckinley Ave
- 2048 4th Ave
- 5723 Nahant Ave
- 6225 Aspen Ave
- 2342 Banning Rd
- 6027 Budmar Ave
- 2503 Flanigan Ct
- 6335 Savannah Ave
- 6227 Station Court Dr
- 2268 Deblin Dr
- 6229 Station Court Dr
- 6233 Station Court Dr
- 2110 Simbury Ct
- 5976 Monticello Ave
- 5970 Monticello Ave
- 2102 Simbury Ct
- 5984 Monticello Ave
- 5945 Bellmeadows Dr
- 6049 Belmont Ave
- 5956 Monticello Ave
- 6047 Belmont Ave
- 6051 Belmont Ave
- 6055 Belmont Ave
- 2109 Simbury Ct
- 5948 Monticello Ave
- 2103 Simbury Ct
- 5939 Bellmeadows Dr
- 5977 Monticello Ave
- 6014 Belmont Ave
- 5985 Monticello Ave
- 6035 Belmont Ave
- 5965 Monticello Ave
Your Personal Tour Guide
Ask me questions while you tour the home.