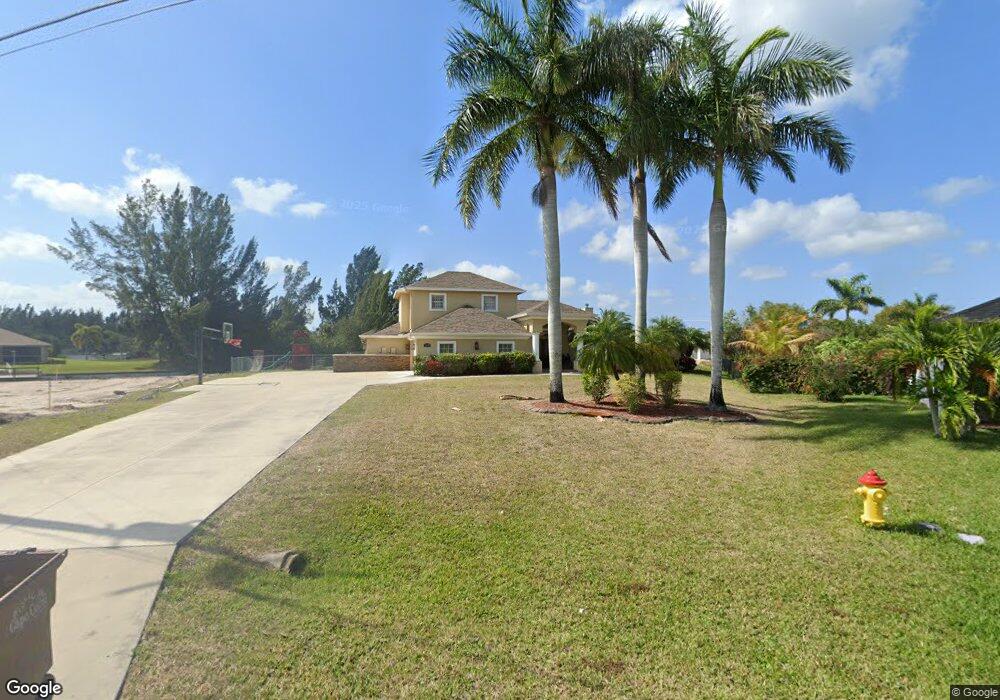
2118 SW 23rd Ct Unit 94 Cape Coral, FL 33991
Trafalgar NeighborhoodEstimated Value: $488,000 - $810,000
3
Beds
4
Baths
3,133
Sq Ft
$216/Sq Ft
Est. Value
About This Home
This home is located at 2118 SW 23rd Ct Unit 94, Cape Coral, FL 33991 and is currently estimated at $676,011, approximately $215 per square foot. 2118 SW 23rd Ct Unit 94 is a home located in Lee County with nearby schools including Caloosa Elementary School, Cape Elementary School, and Tropic Isles Elementary School.
Ownership History
Date
Name
Owned For
Owner Type
Purchase Details
Closed on
Mar 4, 2011
Sold by
Groeper Steve and Groeper Debbie
Bought by
Mackellar Trevor and Mackellar Janine M
Current Estimated Value
Home Financials for this Owner
Home Financials are based on the most recent Mortgage that was taken out on this home.
Original Mortgage
$268,028
Outstanding Balance
$183,901
Interest Rate
4.76%
Mortgage Type
FHA
Estimated Equity
$492,110
Purchase Details
Closed on
May 5, 2006
Sold by
Elkins Chalmer and Elkins Lori
Bought by
Rosen Thomas
Home Financials for this Owner
Home Financials are based on the most recent Mortgage that was taken out on this home.
Original Mortgage
$380,000
Interest Rate
6.33%
Mortgage Type
Fannie Mae Freddie Mac
Purchase Details
Closed on
Feb 7, 2003
Sold by
Ringsmuth Renee and Farr Renee Annette
Bought by
Elkins Chalmer and Elkins Lori
Purchase Details
Closed on
Apr 26, 2001
Sold by
Bruggner Ann
Bought by
Farr Renee Annette
Home Financials for this Owner
Home Financials are based on the most recent Mortgage that was taken out on this home.
Original Mortgage
$7,769
Interest Rate
6.9%
Create a Home Valuation Report for This Property
The Home Valuation Report is an in-depth analysis detailing your home's value as well as a comparison with similar homes in the area
Home Values in the Area
Average Home Value in this Area
Purchase History
| Date | Buyer | Sale Price | Title Company |
|---|---|---|---|
| Mackellar Trevor | $275,000 | Old Florida Title | |
| Rosen Thomas | $630,000 | Heights Title Services Llc | |
| Elkins Chalmer | $25,000 | -- | |
| Farr Renee Annette | $7,500 | -- |
Source: Public Records
Mortgage History
| Date | Status | Borrower | Loan Amount |
|---|---|---|---|
| Open | Mackellar Trevor | $268,028 | |
| Previous Owner | Rosen Thomas | $380,000 | |
| Previous Owner | Farr Renee Annette | $7,769 |
Source: Public Records
Tax History Compared to Growth
Tax History
| Year | Tax Paid | Tax Assessment Tax Assessment Total Assessment is a certain percentage of the fair market value that is determined by local assessors to be the total taxable value of land and additions on the property. | Land | Improvement |
|---|---|---|---|---|
| 2025 | $6,683 | $311,161 | -- | -- |
| 2024 | $6,683 | $302,392 | -- | -- |
| 2023 | $6,532 | $293,584 | $0 | $0 |
| 2022 | $6,269 | $285,033 | $0 | $0 |
| 2021 | $6,401 | $402,656 | $39,330 | $363,326 |
| 2020 | $6,459 | $272,910 | $0 | $0 |
| 2019 | $7,580 | $266,774 | $0 | $0 |
| 2018 | $7,547 | $261,800 | $0 | $0 |
| 2017 | $7,455 | $256,415 | $0 | $0 |
| 2016 | $7,410 | $352,465 | $23,950 | $328,515 |
| 2015 | $7,534 | $278,410 | $20,945 | $257,465 |
| 2014 | $7,438 | $287,101 | $20,532 | $266,569 |
| 2013 | -- | $237,522 | $23,555 | $213,967 |
Source: Public Records
Map
Nearby Homes
- 2115 Surfside Blvd
- 2307 SW 21st Terrace
- 2513 Blackburn Cir
- 2219 Surfside Blvd
- 2450 Verdmont Ct
- 2117 SW 22nd Ct
- 2524 Blackburn Cir
- 2532 Blackburn Cir
- 2534 Verdmont Ct
- 2530 Greendale Place
- 2134 SW 22nd Terrace
- 2549 Verdmont Ct
- 2427 Woodbourne Place
- 2550 Verdmont Ct
- 2088 Cape Heather Cir
- 2060 Cape Heather Cir
- 2492 Hopefield Ct
- 2603 Somerville Loop Unit 106
- 2314 SW 18th St
- 2628 Fairmont Cove Ct
- 2326 SW 21st Terrace
- 2114 SW 23rd Ct
- 2322 SW 21st Terrace
- 2320 SW 21st Terrace
- 2110 SW 23rd Ct
- 2325 SW 21st Terrace
- 2123 Surfside Blvd
- 2327 SW 22nd St
- 2329 SW 22nd St
- 2318 SW 21st Terrace
- 2106 SW 23rd Ct
- 2127 Surfside Blvd
- 2111 Surfside Blvd
- 2321 SW 21st Terrace
- 2323 SW 22nd St
- 2131 Surfside Blvd
- 2324 SW 21st St
- 2314 SW 21st Terrace
- 2100 SW 23rd Ct Unit 94
- 2319 SW 22nd St