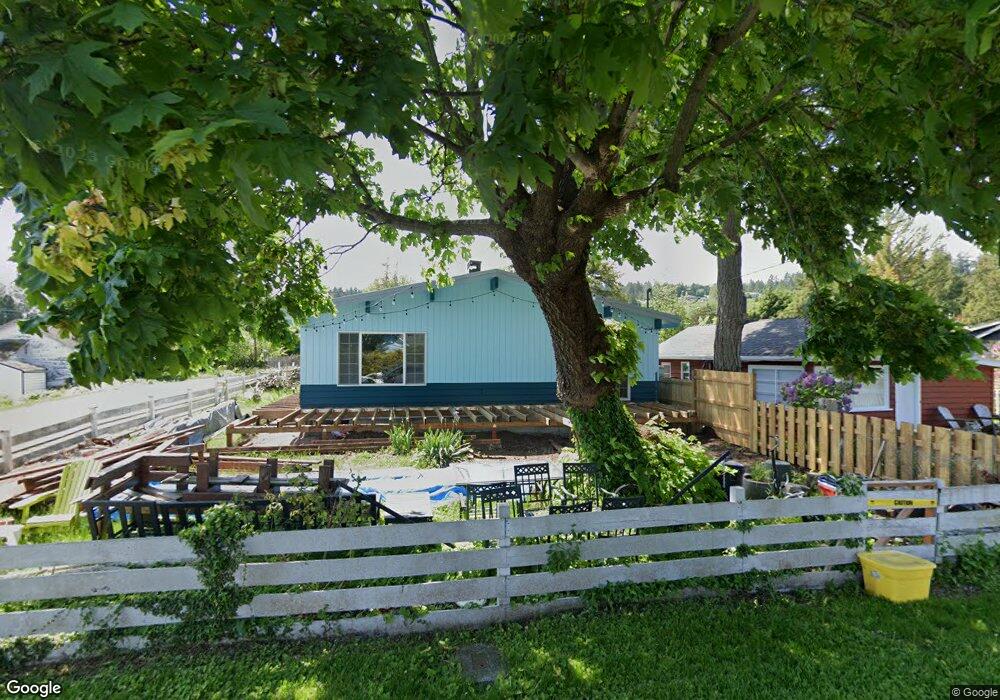
2119 Alder St Point Roberts, WA 98281
Estimated Value: $282,000 - $370,000
2
Beds
1
Bath
1,122
Sq Ft
$295/Sq Ft
Est. Value
About This Home
This home is located at 2119 Alder St, Point Roberts, WA 98281 and is currently estimated at $330,838, approximately $294 per square foot. 2119 Alder St is a home located in Whatcom County with nearby schools including Point Roberts Primary School, Blaine Middle School, and Blaine High School.
Ownership History
Date
Name
Owned For
Owner Type
Purchase Details
Closed on
May 25, 2018
Sold by
Kinnear James Gary
Bought by
Kinnear James Gary
Current Estimated Value
Create a Home Valuation Report for This Property
The Home Valuation Report is an in-depth analysis detailing your home's value as well as a comparison with similar homes in the area
Home Values in the Area
Average Home Value in this Area
Purchase History
| Date | Buyer | Sale Price | Title Company |
|---|---|---|---|
| Kinnear James Gary | -- | None Available |
Source: Public Records
Tax History Compared to Growth
Tax History
| Year | Tax Paid | Tax Assessment Tax Assessment Total Assessment is a certain percentage of the fair market value that is determined by local assessors to be the total taxable value of land and additions on the property. | Land | Improvement |
|---|---|---|---|---|
| 2024 | $2,269 | $278,398 | $114,428 | $163,970 |
| 2023 | $2,269 | $267,995 | $104,025 | $163,970 |
| 2022 | $2,149 | $244,744 | $95,000 | $149,744 |
| 2021 | $2,141 | $210,169 | $80,256 | $129,913 |
| 2020 | $2,133 | $194,598 | $74,310 | $120,288 |
| 2019 | $1,982 | $186,663 | $71,280 | $115,383 |
| 2018 | $1,850 | $167,808 | $64,080 | $103,728 |
| 2017 | $1,605 | $160,266 | $61,200 | $99,066 |
| 2016 | $1,652 | $157,124 | $60,000 | $97,124 |
| 2015 | $1,756 | $157,280 | $57,966 | $99,314 |
| 2014 | -- | $164,424 | $60,600 | $103,824 |
| 2013 | -- | $157,277 | $58,200 | $99,077 |
Source: Public Records
Map
Nearby Homes
- 0 3 73 Acres Derby Ave
- 2145 Fir St
- 103 Goodman Rd
- 251 Elizabeth Dr
- 1931 Sanders Ct Unit 11
- 2138 Benson Rd
- 1871 Johnson Rd
- 302 Boundary Bay Rd
- 4 Boundary Bay Rd
- Lot 35 Boundary Bay Rd
- 0 X Weasel Run
- 412 High Bluff Dr
- 1 Mill Rd
- 2 Mill Rd
- 0 Lot 7 Weasel Run Rd
- 6 Weasel Run Rd
- Lot 2 Greenwood Dr
- 500 Moose Trail
- 25 Roosevelt Way
- 245 Shady Glen Ave