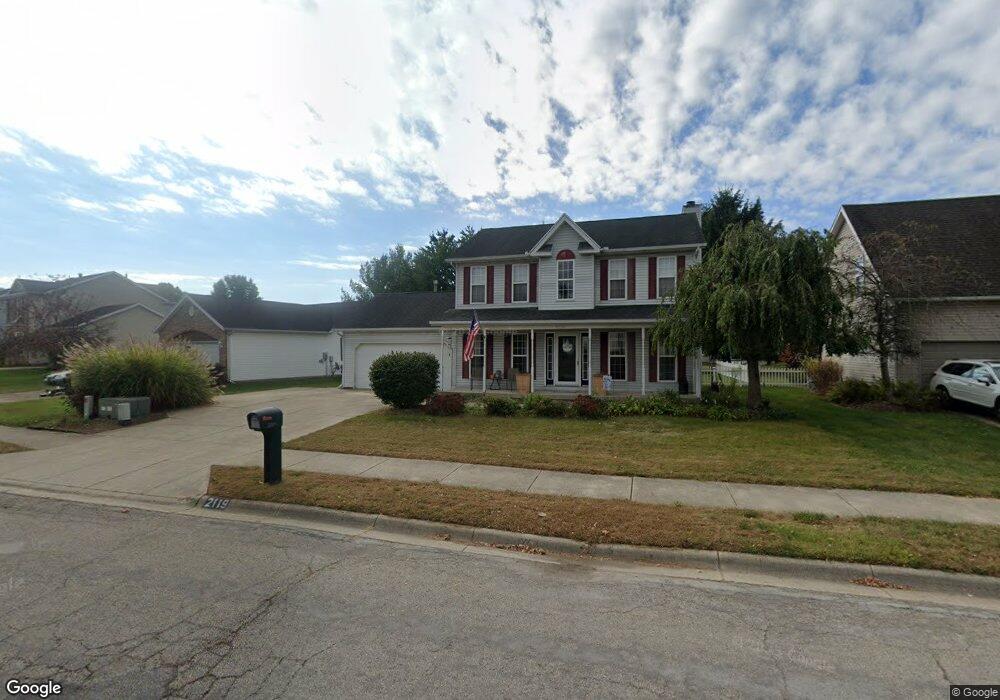
2119 Kittyhawk Ave Springfield, OH 45503
Estimated Value: $280,228 - $347,000
3
Beds
3
Baths
2,436
Sq Ft
$128/Sq Ft
Est. Value
About This Home
This home is located at 2119 Kittyhawk Ave, Springfield, OH 45503 and is currently estimated at $310,807, approximately $127 per square foot. 2119 Kittyhawk Ave is a home located in Clark County with nearby schools including Northridge Elementary School, Kenton Ridge Middle & High School, and Emmanuel Christian Academy.
Ownership History
Date
Name
Owned For
Owner Type
Purchase Details
Closed on
May 3, 2010
Sold by
Moyer Gerald W and Moyer Candice S
Bought by
Ridgeway Rick and Ridgeway Tammy
Current Estimated Value
Home Financials for this Owner
Home Financials are based on the most recent Mortgage that was taken out on this home.
Original Mortgage
$158,730
Interest Rate
5.16%
Mortgage Type
FHA
Purchase Details
Closed on
Aug 1, 2001
Sold by
Metcalf Jeffrey L
Bought by
Moyer Gerald W and Moyer Candice S
Home Financials for this Owner
Home Financials are based on the most recent Mortgage that was taken out on this home.
Original Mortgage
$61,000
Interest Rate
7.14%
Mortgage Type
Purchase Money Mortgage
Purchase Details
Closed on
Jun 6, 1997
Sold by
Brown Robert B
Bought by
Metcalf Jeffrey L
Home Financials for this Owner
Home Financials are based on the most recent Mortgage that was taken out on this home.
Original Mortgage
$102,600
Interest Rate
8.17%
Mortgage Type
New Conventional
Create a Home Valuation Report for This Property
The Home Valuation Report is an in-depth analysis detailing your home's value as well as a comparison with similar homes in the area
Home Values in the Area
Average Home Value in this Area
Purchase History
| Date | Buyer | Sale Price | Title Company |
|---|---|---|---|
| Ridgeway Rick | $171,900 | Buckeye Title | |
| Moyer Gerald W | $161,000 | -- | |
| Metcalf Jeffrey L | $128,250 | -- |
Source: Public Records
Mortgage History
| Date | Status | Borrower | Loan Amount |
|---|---|---|---|
| Closed | Ridgeway Rick | $158,730 | |
| Closed | Moyer Gerald W | $61,000 | |
| Previous Owner | Metcalf Jeffrey L | $102,600 |
Source: Public Records
Tax History
| Year | Tax Paid | Tax Assessment Tax Assessment Total Assessment is a certain percentage of the fair market value that is determined by local assessors to be the total taxable value of land and additions on the property. | Land | Improvement |
|---|---|---|---|---|
| 2025 | $3,163 | $97,870 | $13,060 | $84,810 |
| 2024 | $3,056 | $74,580 | $12,850 | $61,730 |
| 2023 | $3,056 | $74,580 | $12,850 | $61,730 |
| 2022 | $3,068 | $74,580 | $12,850 | $61,730 |
| 2021 | $2,642 | $55,110 | $10,360 | $44,750 |
| 2020 | $2,645 | $55,110 | $10,360 | $44,750 |
| 2019 | $2,698 | $55,110 | $10,360 | $44,750 |
| 2018 | $2,860 | $56,490 | $8,240 | $48,250 |
| 2017 | $2,431 | $57,009 | $8,236 | $48,773 |
| 2016 | $2,413 | $57,009 | $8,236 | $48,773 |
| 2015 | $2,447 | $56,543 | $7,770 | $48,773 |
| 2014 | $2,446 | $56,543 | $7,770 | $48,773 |
| 2013 | $2,441 | $56,543 | $7,770 | $48,773 |
Source: Public Records
Map
Nearby Homes
- 2861 Ashlar Dr
- 2043 Providence Ave
- 2332 Villa Rd
- 3214 Revels St
- 3300 Revels St
- 2022 Westboro Ave
- 2529 Marinette Dr
- 1924 Marinette Dr
- 3126 Lakeview Ct Unit 3126
- 1948 Falmouth Ave
- 2400 Thor Dr
- 1811 Devon Dr
- 1516 Hyannis Dr
- 1711 Pinehurst Dr
- 1831 Pinehurst Dr Unit 37
- 1507 Kingsgate Rd
- 1505 Kingsgate Rd
- 1503 Kingsgate Rd
- 3631 Kingsgate Ln
- 1040 Carson Ln
- 2115 Kittyhawk Ave
- 2125 Kittyhawk Ave
- 2735 Vada Ln
- 2129 Kittyhawk Ave
- 2738 Old Oak Ln
- 2729 Vada Ln
- 2128 Kittyhawk Ave
- 2133 Kittyhawk Ave
- 2107 Kittyhawk Ave
- 2734 Vada Ln
- 2112 Kittyhawk Ave
- 2735 Ashlar Dr
- 2739 Ashlar Dr
- 2740 Old Oak Ln
- 2124 Conowoods Dr
- 2130 Conowoods Dr
- 2137 Kittyhawk Ave
- 2741 Old Oak Ln
- 2736 Ashlar Dr
- 2108 Conowoods Dr
Your Personal Tour Guide
Ask me questions while you tour the home.