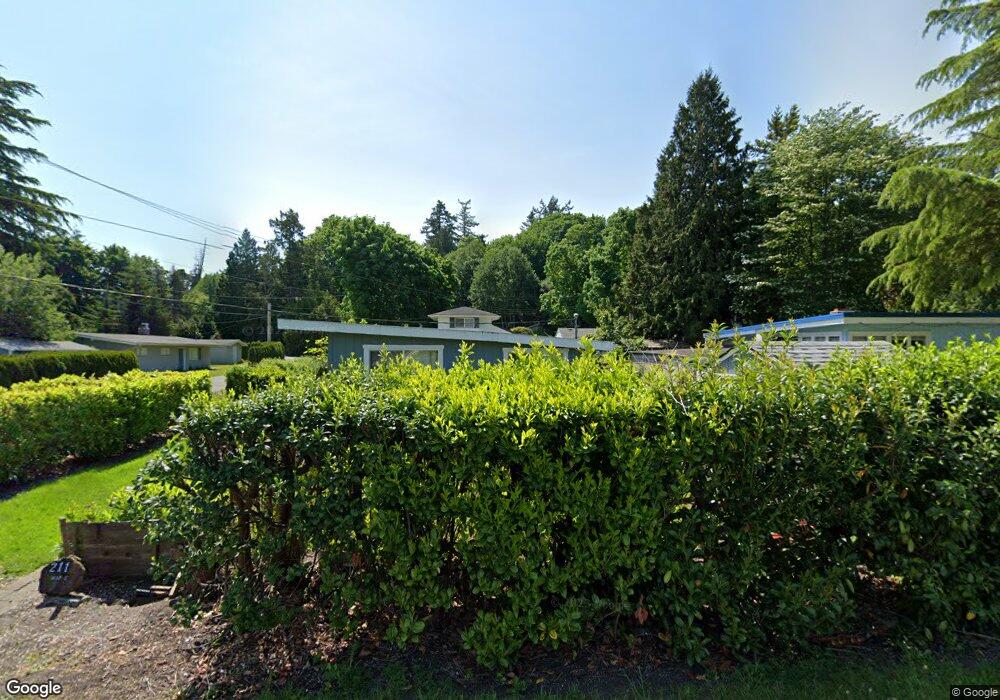
2119 Maple St Point Roberts, WA 98281
Estimated Value: $187,000 - $448,000
2
Beds
1
Bath
572
Sq Ft
$533/Sq Ft
Est. Value
About This Home
This home is located at 2119 Maple St, Point Roberts, WA 98281 and is currently estimated at $304,787, approximately $532 per square foot. 2119 Maple St is a home located in Whatcom County with nearby schools including Point Roberts Primary School, Blaine Middle School, and Blaine High School.
Ownership History
Date
Name
Owned For
Owner Type
Purchase Details
Closed on
Jul 30, 2014
Sold by
Martin Wayne Garry
Bought by
Martin Evelyn
Current Estimated Value
Create a Home Valuation Report for This Property
The Home Valuation Report is an in-depth analysis detailing your home's value as well as a comparison with similar homes in the area
Home Values in the Area
Average Home Value in this Area
Purchase History
| Date | Buyer | Sale Price | Title Company |
|---|---|---|---|
| Martin Evelyn | -- | Whatcom Land Title | |
| Tomlinson Cheryl | $187,280 | Whatcom Land Title |
Source: Public Records
Tax History
| Year | Tax Paid | Tax Assessment Tax Assessment Total Assessment is a certain percentage of the fair market value that is determined by local assessors to be the total taxable value of land and additions on the property. | Land | Improvement |
|---|---|---|---|---|
| 2025 | $1,740 | $199,196 | $115,568 | $83,628 |
| 2024 | $1,651 | $197,224 | $114,428 | $82,796 |
| 2023 | $1,651 | $186,821 | $104,025 | $82,796 |
| 2022 | $1,659 | $170,613 | $95,000 | $75,613 |
| 2021 | $1,653 | $156,668 | $80,256 | $76,412 |
| 2020 | $1,649 | $145,061 | $74,310 | $70,751 |
| 2019 | $1,536 | $139,146 | $71,280 | $67,866 |
| 2018 | $1,384 | $125,091 | $64,080 | $61,011 |
| 2017 | $1,201 | $119,469 | $61,200 | $58,269 |
| 2016 | $1,241 | $117,126 | $60,000 | $57,126 |
| 2015 | $1,319 | $117,708 | $57,966 | $59,742 |
| 2014 | -- | $123,055 | $60,600 | $62,455 |
| 2013 | -- | $117,800 | $58,200 | $59,600 |
Source: Public Records
Map
Nearby Homes
- 103 Goodman Rd
- 0 3 73 Acres Derby Ave
- 0 15 Whalen Dr
- 19 Whalen Dr
- 251 Elizabeth Dr
- 1928 Sanders Ct Unit 2
- 2138 Benson Rd
- 1871 Johnson Rd
- 0 Deer Rd
- 6 Weasel Run Rd
- 1 Mill Rd
- 2 Mill Rd
- 245 Shady Glen Ave
- 25 Roosevelt Way
- 1774 Centennial Place
- 125 Park Dr
- 2045 Apa Rd
- 1940 Apa Rd
- 157 Northwood Dr
- 0 Tyee Dr
Your Personal Tour Guide
Ask me questions while you tour the home.