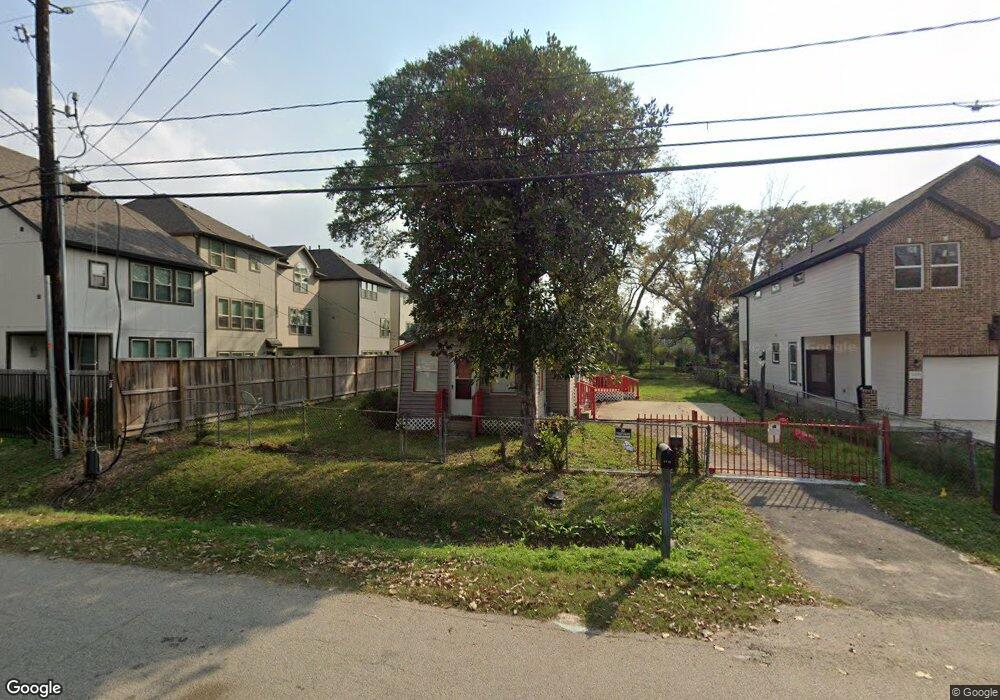
2119 Paul Quinn St Houston, TX 77091
Acres Homes NeighborhoodEstimated Value: $135,426 - $208,000
2
Beds
1
Bath
584
Sq Ft
$296/Sq Ft
Est. Value
About This Home
This home is located at 2119 Paul Quinn St, Houston, TX 77091 and is currently estimated at $173,107, approximately $296 per square foot. 2119 Paul Quinn St is a home located in Harris County with nearby schools including Highland Heights Elementary School, Williams Middle, and Waltrip High School.
Ownership History
Date
Name
Owned For
Owner Type
Purchase Details
Closed on
Jan 4, 2012
Sold by
Vistamont Realty Management Inc
Bought by
Scott Randolph A
Current Estimated Value
Purchase Details
Closed on
Jul 6, 2011
Sold by
Bennett Christopher and Bennett Jesha
Bought by
Vistamont Realty Management Inc
Purchase Details
Closed on
Feb 1, 2010
Sold by
Vistamont Realty Management Inc
Bought by
Bennett Christopher and Bennett Ieisha
Purchase Details
Closed on
May 4, 2009
Sold by
Thomas Robert
Bought by
Vistamont Management Inc
Purchase Details
Closed on
Oct 17, 2007
Sold by
Wheat Hannah Freeman and Wheat Hannah Gray
Bought by
Thomas Robert
Create a Home Valuation Report for This Property
The Home Valuation Report is an in-depth analysis detailing your home's value as well as a comparison with similar homes in the area
Home Values in the Area
Average Home Value in this Area
Purchase History
| Date | Buyer | Sale Price | Title Company |
|---|---|---|---|
| Scott Randolph A | -- | American Title Co | |
| Vistamont Realty Management Inc | $62,593 | None Available | |
| Bennett Christopher | -- | None Available | |
| Vistamont Management Inc | -- | Fidelity National Title Co | |
| Thomas Robert | -- | American Title Co |
Source: Public Records
Mortgage History
| Date | Status | Borrower | Loan Amount |
|---|---|---|---|
| Closed | Bennett Christopher | $0 |
Source: Public Records
Tax History Compared to Growth
Tax History
| Year | Tax Paid | Tax Assessment Tax Assessment Total Assessment is a certain percentage of the fair market value that is determined by local assessors to be the total taxable value of land and additions on the property. | Land | Improvement |
|---|---|---|---|---|
| 2025 | $2,340 | $116,568 | $83,200 | $33,368 |
| 2024 | $2,340 | $111,835 | $83,200 | $28,635 |
| 2023 | $2,340 | $111,835 | $83,200 | $28,635 |
| 2022 | $1,881 | $85,424 | $57,600 | $27,824 |
| 2021 | $1,442 | $61,850 | $38,400 | $23,450 |
| 2020 | $1,248 | $51,516 | $30,400 | $21,116 |
| 2019 | $1,509 | $59,639 | $41,580 | $18,059 |
| 2018 | $1,308 | $51,693 | $34,650 | $17,043 |
| 2017 | $1,170 | $46,278 | $28,875 | $17,403 |
| 2016 | $1,170 | $46,278 | $28,875 | $17,403 |
| 2015 | $693 | $39,063 | $23,100 | $15,963 |
| 2014 | $693 | $26,963 | $11,550 | $15,413 |
Source: Public Records
Map
Nearby Homes
- 2027 Paul Quinn St
- 2000 Paul Quinn
- 2202 Paul Quinn St
- 2224 Paul Quinn St
- 2300 W Tidwell Rd
- 1905 W Tidwell Rd
- 1801 Don Alejandro
- 1826 W Tidwell Rd
- 5502 Paraiso Place
- 1852 W Tidwell Rd
- 1850 W Tidwell Rd
- 1844 W Tidwell Rd
- 5511 Robusto Place
- 1728 Tornado
- 1824 W Tidwell Rd
- 1830 W Tidwell Rd
- 0 Felicia St Unit 45670358
- 5818 Francis Oak Place
- 00 Paul Quinn St
- 2328 Paul Quinn St
- 2125 Paul Quinn St
- 2115 Paul Quinn St
- 2113 Paul Quinn St
- 2117 Paul Quinn St
- 5618 Duoto St
- 2111 Paul Quinn St
- 2109 Paul Quinn St
- 5622 Duoto St
- 2110 Paul Quinn St
- 5614 Duoto St
- 2017 Paul Quinn St
- 2105 Paul Quinn St
- 2019 Paul Quinn St
- 2021 Paul Quinn St
- 2107 Paul Quinn St
- 2023 Paul Quinn St
- 0 Cebra St N
- 2025 Paul Quinn St
- 2103 Paul Quinn St
- 2114 Paul Quinn St