
Landlord's Agent in 2022
Jina Moussavi
Long & Foster
(703) 819-2961
1 in this area
3 Total Sales


Estimated Value: $325,921 - $341,000
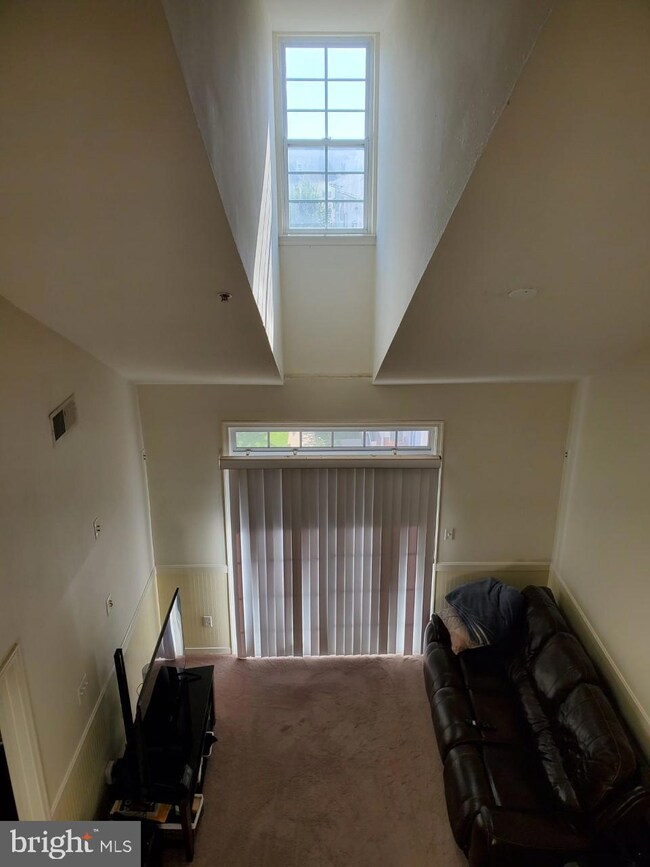
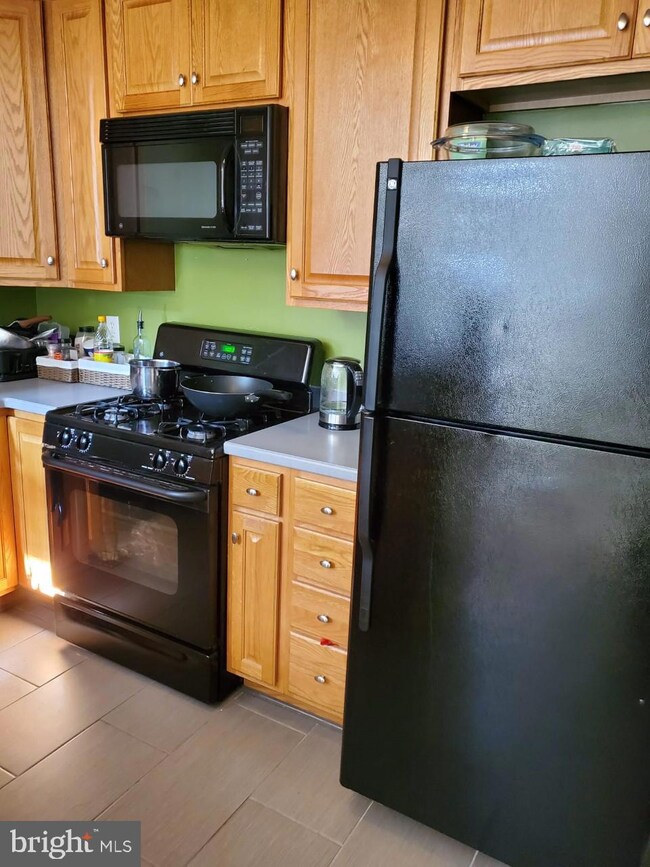
SUNNY & BRIGHT WITH LARGE WINDOWS AND CATHEDRAL CEILING . LARGE KITCHEN AND BREAKFAST AREA . LOTS OF STORAGE SPACE AND A STUDIO ON 2ND LEVEL. CLOSE TO CASCADES SHOPPING CENTER W/ GROCERY STORE, RESTAURANTS AND MORE. LOTS OF AMENITIES INCLUDED IN THE COMMUNITY.
CLOSE TO ALL ROUTES. CLOSE TO 1000 SQ. FT.
CALL THE AGENT FOR SHOWING. TENANT WORKS FROM HOME . NO LOCK BOX.
TENANT NEEDS 24 HRS NOTICE FOR SHOWING.
Last Agent to Rent the Property
(703) 819-2961 jina.moussavi@longandfoster.com Long & Foster Real Estate, Inc. Listed on: 10/10/2022
Last Renter's Agent
(703) 819-2961 jina.moussavi@longandfoster.com Long & Foster Real Estate, Inc. Listed on: 10/10/2022
| Date | Buyer | Sale Price | Title Company |
|---|---|---|---|
| Monajemy Nooshin | $165,000 | -- |
| Date | Event | Price | List to Sale | Price per Sq Ft | Prior Sale |
|---|---|---|---|---|---|
| 11/24/2022 11/24/22 | Rented | $1,795 | 0.0% | -- | |
| 10/10/2022 10/10/22 | For Rent | $1,795 | +28.2% | -- | |
| 12/03/2015 12/03/15 | Rented | $1,400 | 0.0% | -- | |
| 12/02/2015 12/02/15 | Under Contract | -- | -- | -- | |
| 09/11/2015 09/11/15 | For Rent | $1,400 | +0.1% | -- | |
| 03/11/2015 03/11/15 | Rented | $1,399 | 0.0% | -- | |
| 03/10/2015 03/10/15 | Under Contract | -- | -- | -- | |
| 02/20/2015 02/20/15 | For Rent | $1,399 | -0.1% | -- | |
| 10/03/2014 10/03/14 | Rented | $1,400 | 0.0% | -- | |
| 10/03/2014 10/03/14 | Under Contract | -- | -- | -- | |
| 08/27/2014 08/27/14 | For Rent | $1,400 | 0.0% | -- | |
| 06/03/2014 06/03/14 | Rented | $1,400 | 0.0% | -- | |
| 06/03/2014 06/03/14 | Under Contract | -- | -- | -- | |
| 05/07/2014 05/07/14 | For Rent | $1,400 | +0.1% | -- | |
| 05/13/2013 05/13/13 | Rented | $1,399 | -0.1% | -- | |
| 05/10/2013 05/10/13 | Under Contract | -- | -- | -- | |
| 04/08/2013 04/08/13 | For Rent | $1,400 | 0.0% | -- | |
| 02/28/2013 02/28/13 | Rented | $1,400 | -6.7% | -- | |
| 02/28/2013 02/28/13 | Under Contract | -- | -- | -- | |
| 01/31/2013 01/31/13 | For Rent | $1,500 | 0.0% | -- | |
| 01/24/2013 01/24/13 | Sold | $165,000 | +3.1% | $206 / Sq Ft | View Prior Sale |
| 09/01/2012 09/01/12 | Pending | -- | -- | -- | |
| 08/25/2012 08/25/12 | For Sale | $160,000 | -- | $200 / Sq Ft |
| Year | Tax Paid | Tax Assessment Tax Assessment Total Assessment is a certain percentage of the fair market value that is determined by local assessors to be the total taxable value of land and additions on the property. | Land | Improvement |
|---|---|---|---|---|
| 2025 | $2,505 | $311,200 | $95,000 | $216,200 |
| 2024 | $2,367 | $273,600 | $95,000 | $178,600 |
| 2023 | $2,312 | $264,200 | $95,000 | $169,200 |
| 2022 | $2,240 | $251,720 | $75,000 | $176,720 |
| 2021 | $2,301 | $234,810 | $75,000 | $159,810 |
| 2020 | $2,313 | $223,440 | $60,000 | $163,440 |
| 2019 | $2,278 | $217,980 | $50,000 | $167,980 |
| 2018 | $2,217 | $204,360 | $50,000 | $154,360 |
| 2017 | $2,146 | $190,740 | $50,000 | $140,740 |
| 2016 | $2,101 | $183,480 | $0 | $0 |
| 2015 | $1,938 | $120,760 | $0 | $120,760 |
| 2014 | $1,972 | $120,760 | $0 | $120,760 |
Landlord's Agent in 2022
Jina Moussavi
Long & Foster
(703) 819-2961
1 in this area
3 Total Sales
Seller's Agent in 2013
Robert Chevez
EXP Realty, LLC
(703) 596-9448
1 in this area
115 Total Sales
Source: Bright MLS
MLS Number: VALO2038536
APN: 019-18-2872-013
Disclaimer: Certain information contained herein is derived from information provided by parties other than Homes.com. All information provided is deemed reliable, but is not guaranteed to be accurate and should be independently verified.
![]() The data relating to real estate for sale on this website appears in part through the BRIGHT Internet Data Exchange program, a voluntary cooperative exchange of property listing data between licensed real estate brokerage firms, and is provided by BRIGHT through a licensing agreement.
The data relating to real estate for sale on this website appears in part through the BRIGHT Internet Data Exchange program, a voluntary cooperative exchange of property listing data between licensed real estate brokerage firms, and is provided by BRIGHT through a licensing agreement.
Listing information is from various brokers who participate in the Bright MLS IDX program and not all listings may be visible on the site.
The property information being provided on or through the website is for the personal, non-commercial use of consumers and such information may not be used for any purpose other than to identify prospective properties consumers may be interested in purchasing.
Some properties which appear for sale on the website may no longer be available because they are for instance, under contract, sold or are no longer being offered for sale.
Property information displayed is deemed reliable but is not guaranteed.
Copyright 2025 Bright MLS, Inc.