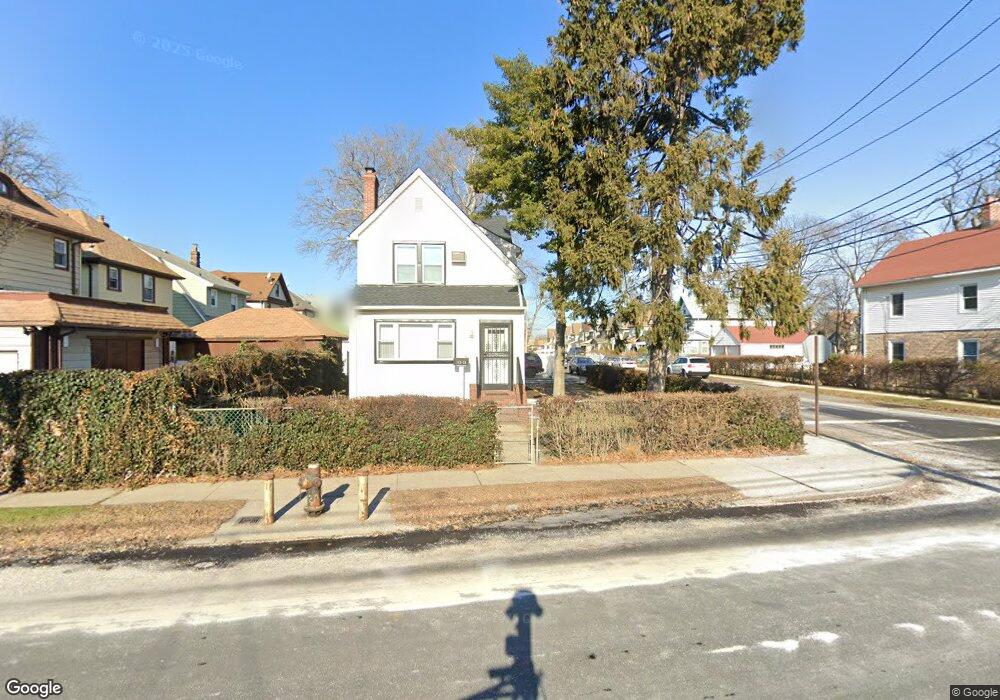
212-11 Hollis Ave Queens Village, NY 11429
Queens Village NeighborhoodEstimated Value: $759,000 - $901,000
4
Beds
4
Baths
1,188
Sq Ft
$684/Sq Ft
Est. Value
About This Home
This home is located at 212-11 Hollis Ave, Queens Village, NY 11429 and is currently estimated at $812,435, approximately $683 per square foot. 212-11 Hollis Ave is a home located in Queens County with nearby schools including P.S. 34 John Harvard, Jean Nuzzi Intermediate School, and Ss Joachim & Anne School.
Ownership History
Date
Name
Owned For
Owner Type
Purchase Details
Closed on
Oct 30, 2017
Sold by
Craft Equity Llc
Bought by
Borja Eva R and Borja Ceasar R
Current Estimated Value
Home Financials for this Owner
Home Financials are based on the most recent Mortgage that was taken out on this home.
Original Mortgage
$496,000
Outstanding Balance
$415,405
Interest Rate
3.83%
Mortgage Type
New Conventional
Estimated Equity
$397,030
Purchase Details
Closed on
Jun 2, 2017
Sold by
Smith Shirley L
Bought by
Craft Equity Llc
Home Financials for this Owner
Home Financials are based on the most recent Mortgage that was taken out on this home.
Original Mortgage
$335,000
Interest Rate
4.03%
Mortgage Type
New Conventional
Purchase Details
Closed on
Apr 2, 1999
Sold by
Smith Ronald O and Smith Shirley L
Bought by
Smith Shirley L
Create a Home Valuation Report for This Property
The Home Valuation Report is an in-depth analysis detailing your home's value as well as a comparison with similar homes in the area
Home Values in the Area
Average Home Value in this Area
Purchase History
| Date | Buyer | Sale Price | Title Company |
|---|---|---|---|
| Borja Eva R | $620,000 | -- | |
| Borja Eva R | $620,000 | -- | |
| Craft Equity Llc | $375,000 | -- | |
| Craft Equity Llc | $375,000 | -- | |
| Smith Shirley L | -- | Lawyers Title Insurance Corp | |
| Smith Shirley L | -- | Lawyers Title Insurance Corp |
Source: Public Records
Mortgage History
| Date | Status | Borrower | Loan Amount |
|---|---|---|---|
| Open | Borja Eva R | $496,000 | |
| Closed | Borja Eva R | $496,000 | |
| Previous Owner | Craft Equity Llc | $335,000 |
Source: Public Records
Tax History Compared to Growth
Tax History
| Year | Tax Paid | Tax Assessment Tax Assessment Total Assessment is a certain percentage of the fair market value that is determined by local assessors to be the total taxable value of land and additions on the property. | Land | Improvement |
|---|---|---|---|---|
| 2025 | $5,649 | $29,810 | $7,863 | $21,947 |
| 2024 | $5,649 | $28,124 | $8,362 | $19,762 |
| 2023 | $5,489 | $27,329 | $7,803 | $19,526 |
| 2022 | $5,365 | $38,580 | $12,060 | $26,520 |
| 2021 | $5,542 | $37,020 | $12,060 | $24,960 |
| 2020 | $5,258 | $37,260 | $12,060 | $25,200 |
| 2019 | $4,903 | $32,580 | $12,060 | $20,520 |
| 2018 | $4,642 | $22,774 | $10,061 | $12,713 |
| 2017 | $4,265 | $22,394 | $11,309 | $11,085 |
| 2016 | $1,572 | $22,394 | $11,309 | $11,085 |
| 2015 | $835 | $20,702 | $10,233 | $10,469 |
| 2014 | $835 | $19,531 | $9,880 | $9,651 |
Source: Public Records
Map
Nearby Homes
- 109-28 212th St
- 104-37 214th St
- 106-16 215th St
- 109-09 215th St
- 104-50 210th St
- 109-49 215th St
- 104-24 210th St
- 10221 213th St
- 10219 213th St
- 11028 213th St
- 10418 216th St
- 11034 214th St
- 10925 208th St
- 110-06 209th Place
- 11119 212th St
- 21607 110th Ave
- 213-19 102nd Ave
- 106-10 217th St
- 10218 216th St
- 21609 104th Ave
- 10475 212th St
- 10475 212th St
- 10474 212th St
- 10469 212th St
- 21211 Hollis Ave
- 10467 212th St
- 10465 212th St
- 10465 212th St
- 212-14 Hollis Ave
- 212-04 Hollis Ave
- 21210 Hollis Ave
- 21214 Hollis Ave
- 21208 Hollis Ave
- 21212 Hollis Ave
- 10463 212th St
- 212-18 Hollis Ave
- 21206 Hollis Ave
- 21214 Hollis Ave
- 212-24 Hollis Ave
- 212-23 Hollis Ave