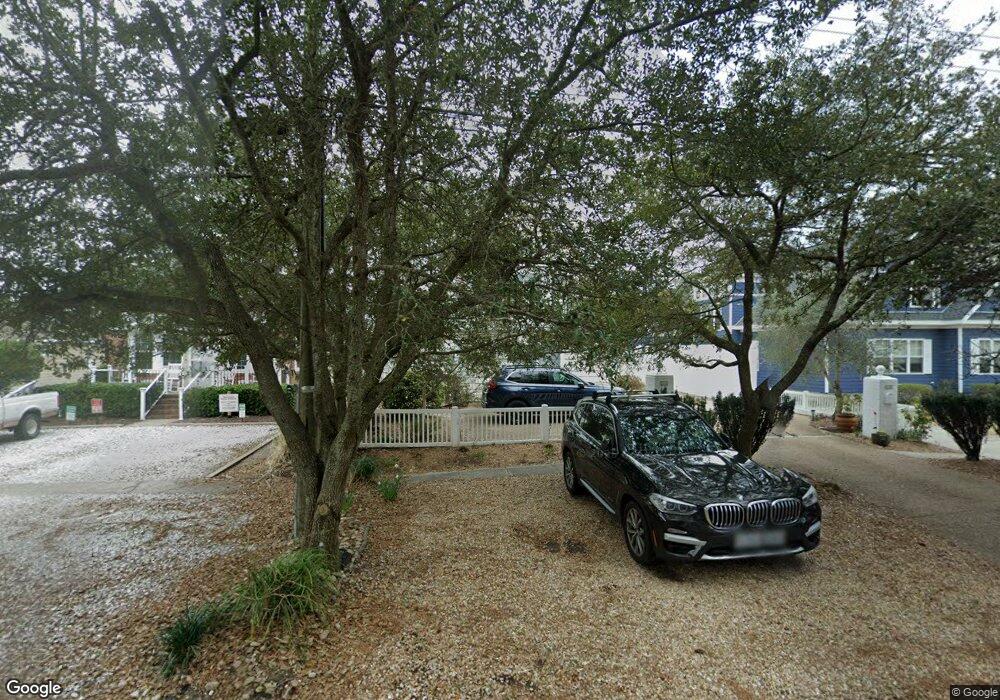
212 79th St Unit A Virginia Beach, VA 23451
North End NeighborhoodEstimated Value: $1,071,000 - $1,189,000
3
Beds
3
Baths
2,576
Sq Ft
$436/Sq Ft
Est. Value
About This Home
This home is located at 212 79th St Unit A, Virginia Beach, VA 23451 and is currently estimated at $1,124,156, approximately $436 per square foot. 212 79th St Unit A is a home located in Virginia Beach City with nearby schools including Linkhorn Park Elementary School, Virginia Beach Middle School, and Frank W. Cox High School.
Ownership History
Date
Name
Owned For
Owner Type
Purchase Details
Closed on
Aug 17, 2005
Sold by
Marzahn Charles W
Bought by
Duntemann Thomas J
Current Estimated Value
Home Financials for this Owner
Home Financials are based on the most recent Mortgage that was taken out on this home.
Original Mortgage
$600,000
Outstanding Balance
$315,188
Interest Rate
5.66%
Mortgage Type
New Conventional
Estimated Equity
$808,968
Purchase Details
Closed on
Jun 17, 2003
Sold by
Habr Khalil
Bought by
Marzahn Charles
Home Financials for this Owner
Home Financials are based on the most recent Mortgage that was taken out on this home.
Original Mortgage
$322,700
Interest Rate
5.77%
Mortgage Type
New Conventional
Create a Home Valuation Report for This Property
The Home Valuation Report is an in-depth analysis detailing your home's value as well as a comparison with similar homes in the area
Home Values in the Area
Average Home Value in this Area
Purchase History
| Date | Buyer | Sale Price | Title Company |
|---|---|---|---|
| Duntemann Thomas J | $800,000 | -- | |
| Marzahn Charles | $450,000 | -- |
Source: Public Records
Mortgage History
| Date | Status | Borrower | Loan Amount |
|---|---|---|---|
| Open | Duntemann Thomas J | $600,000 | |
| Previous Owner | Marzahn Charles | $322,700 |
Source: Public Records
Tax History Compared to Growth
Tax History
| Year | Tax Paid | Tax Assessment Tax Assessment Total Assessment is a certain percentage of the fair market value that is determined by local assessors to be the total taxable value of land and additions on the property. | Land | Improvement |
|---|---|---|---|---|
| 2025 | $8,696 | $1,049,900 | $550,000 | $499,900 |
| 2024 | $8,696 | $896,500 | $500,000 | $396,500 |
| 2023 | $8,316 | $840,000 | $459,400 | $380,600 |
| 2022 | $7,520 | $759,600 | $365,600 | $394,000 |
| 2021 | $7,097 | $716,900 | $365,600 | $351,300 |
| 2020 | $7,342 | $721,600 | $365,600 | $356,000 |
| 2019 | $7,313 | $713,900 | $300,000 | $413,900 |
| 2018 | $7,157 | $713,900 | $300,000 | $413,900 |
| 2017 | $6,922 | $690,500 | $276,600 | $413,900 |
| 2016 | $7,022 | $709,300 | $295,400 | $413,900 |
| 2015 | $6,273 | $633,600 | $281,300 | $352,300 |
| 2014 | $5,195 | $566,600 | $276,600 | $290,000 |
Source: Public Records
Map
Nearby Homes
- 219 77th St Unit B
- 106 80th St
- 7605 Atlantic Ave
- 213 81st St Unit A
- 207 82nd St Unit A
- 113 73rd St Unit A
- 7112 Atlantic Ave
- 8600 Ocean Front Ave
- 6904 Ocean Front Ave
- 8704 Atlantic Ave Unit B
- 8708 Atlantic Ave
- 125 67th St
- 6606 Atlantic Ave
- 6604 Atlantic Ave
- 213 66th St Unit B
- 228 66th St
- 219 64th St
- 436 Gosnold Ct
- 557 Susan Constant Dr
- 5604 Holly Rd Unit B
- 212 79th St Unit B
- 210 79th St
- 214 79th St
- 208 79th St Unit B
- 208 79th St Unit A
- 215 78th St Unit A
- 215 78th St Unit B
- 216 79th St
- 213 78th St
- 213 78th St Unit A
- 211 78th St
- 217 78th St Unit B
- 217 78th St Unit A
- 218 79th St
- 206 79th St Unit A
- 206 79th St Unit B
- 209 78th St
- 209 78th St Unit B
- 209 78th St Unit A
- 207 78th St