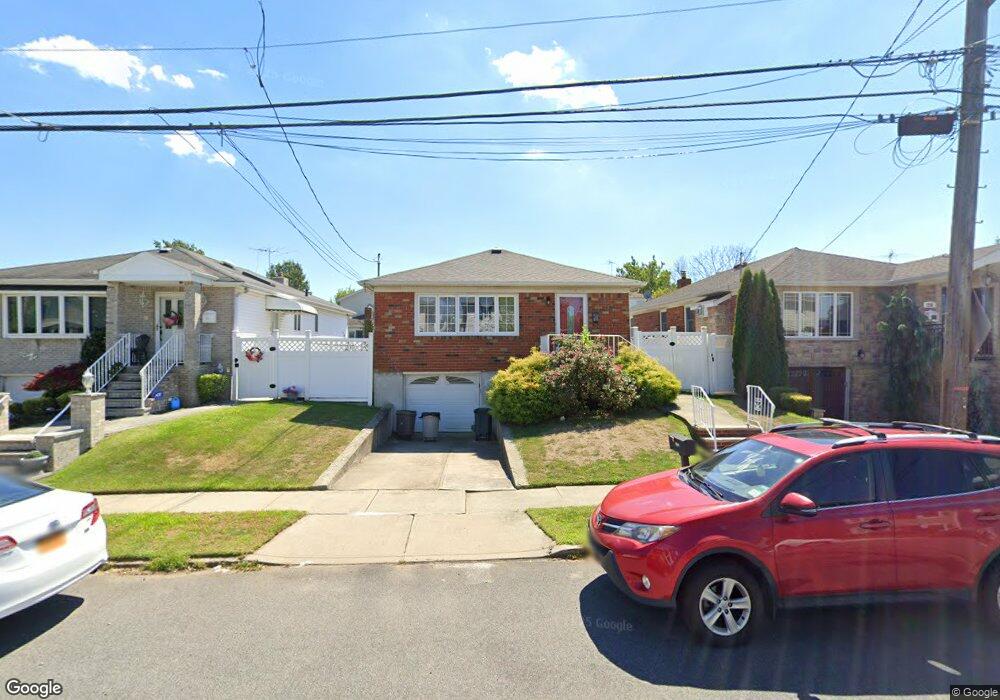
212 Amber St Staten Island, NY 10306
Richmondtown NeighborhoodEstimated Value: $661,543 - $994,000
--
Bed
4
Baths
1,056
Sq Ft
$750/Sq Ft
Est. Value
About This Home
This home is located at 212 Amber St, Staten Island, NY 10306 and is currently estimated at $791,636, approximately $749 per square foot. 212 Amber St is a home located in Richmond County with nearby schools including P.S. 23 Richmondtown, Myra S. Barnes Intermediate School 24, and Susan E Wagner High School.
Ownership History
Date
Name
Owned For
Owner Type
Purchase Details
Closed on
Jun 14, 2019
Sold by
Dudziec David H
Bought by
Dragonetti Alice D
Current Estimated Value
Home Financials for this Owner
Home Financials are based on the most recent Mortgage that was taken out on this home.
Original Mortgage
$375,000
Outstanding Balance
$328,373
Interest Rate
3.9%
Mortgage Type
New Conventional
Estimated Equity
$463,263
Create a Home Valuation Report for This Property
The Home Valuation Report is an in-depth analysis detailing your home's value as well as a comparison with similar homes in the area
Home Values in the Area
Average Home Value in this Area
Purchase History
| Date | Buyer | Sale Price | Title Company |
|---|---|---|---|
| Dragonetti Alice D | -- | Commonwealth Land Ttl Ins Co |
Source: Public Records
Mortgage History
| Date | Status | Borrower | Loan Amount |
|---|---|---|---|
| Open | Dragonetti Alice D | $375,000 |
Source: Public Records
Tax History Compared to Growth
Tax History
| Year | Tax Paid | Tax Assessment Tax Assessment Total Assessment is a certain percentage of the fair market value that is determined by local assessors to be the total taxable value of land and additions on the property. | Land | Improvement |
|---|---|---|---|---|
| 2025 | $7,545 | $40,440 | $12,302 | $28,138 |
| 2024 | $7,545 | $43,200 | $10,957 | $32,243 |
| 2023 | $7,198 | $35,442 | $9,542 | $25,900 |
| 2022 | $6,675 | $41,820 | $12,600 | $29,220 |
| 2021 | $7,037 | $40,980 | $12,600 | $28,380 |
| 2020 | $7,622 | $40,920 | $12,600 | $28,320 |
| 2019 | $5,946 | $40,500 | $12,600 | $27,900 |
| 2018 | $5,434 | $29,535 | $12,355 | $17,180 |
| 2017 | $5,327 | $27,864 | $11,340 | $16,524 |
| 2016 | $5,220 | $27,864 | $12,140 | $15,724 |
| 2015 | $4,697 | $27,420 | $11,160 | $16,260 |
| 2014 | $4,697 | $26,089 | $9,843 | $16,246 |
Source: Public Records
Map
Nearby Homes