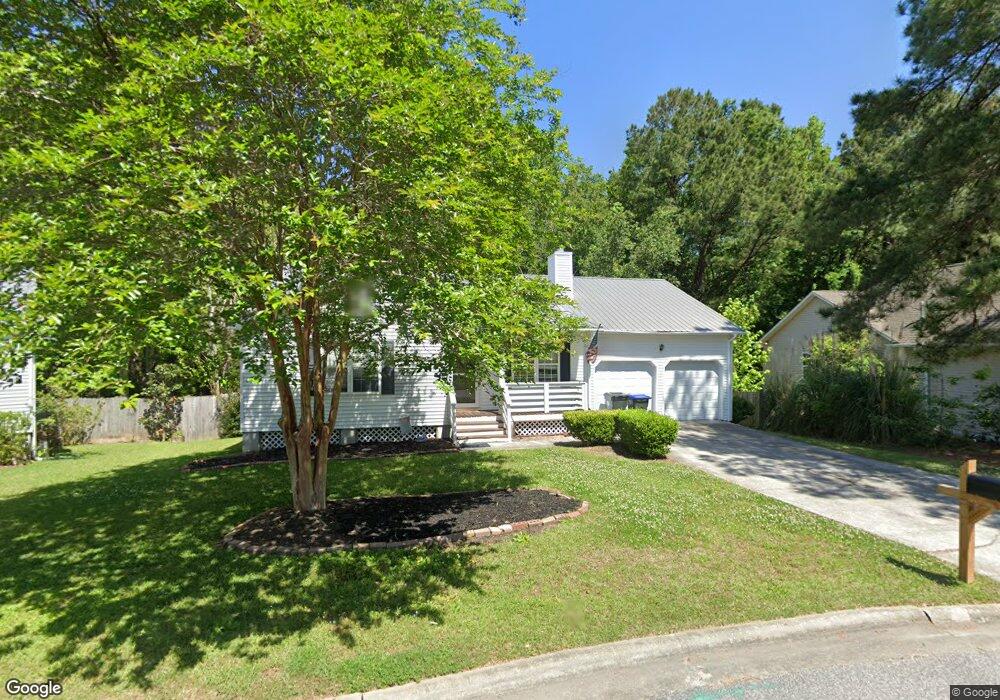
212 Amberjack Way Summerville, SC 29485
Estimated Value: $302,000 - $331,000
3
Beds
2
Baths
1,201
Sq Ft
$261/Sq Ft
Est. Value
About This Home
This home is located at 212 Amberjack Way, Summerville, SC 29485 and is currently estimated at $313,587, approximately $261 per square foot. 212 Amberjack Way is a home located in Dorchester County with nearby schools including Flowertown Elementary School, Gregg Middle School, and Summerville High School.
Ownership History
Date
Name
Owned For
Owner Type
Purchase Details
Closed on
Sep 20, 2018
Sold by
Heber Jeak K
Bought by
Johnson Taylor Leigh
Current Estimated Value
Purchase Details
Closed on
Jun 24, 2013
Sold by
Heber Jean K and Daniels Teresa J
Bought by
Heber Jean K
Home Financials for this Owner
Home Financials are based on the most recent Mortgage that was taken out on this home.
Original Mortgage
$99,900
Interest Rate
3.59%
Mortgage Type
Future Advance Clause Open End Mortgage
Purchase Details
Closed on
Aug 17, 2009
Sold by
Heber Jean K
Bought by
Heber Jean K and Daniels Teresa J
Purchase Details
Closed on
Oct 17, 2006
Sold by
Heber Benjamin W
Bought by
Heber Jean K
Purchase Details
Closed on
Jun 23, 2003
Sold by
Mcshane Brian P and Mcshane Lauri A
Bought by
Heber Jean and Heber Benjamin W
Purchase Details
Closed on
Aug 20, 2001
Sold by
Mcshane Brian P
Bought by
Mcshane Brian P and Mcshane Lauri A
Create a Home Valuation Report for This Property
The Home Valuation Report is an in-depth analysis detailing your home's value as well as a comparison with similar homes in the area
Home Values in the Area
Average Home Value in this Area
Purchase History
| Date | Buyer | Sale Price | Title Company |
|---|---|---|---|
| Johnson Taylor Leigh | -- | None Available | |
| Heber Jean K | -- | -- | |
| Heber Jean K | -- | -- | |
| Heber Jean K | -- | None Available | |
| Heber Jean | $123,900 | -- | |
| Mcshane Brian P | $125,000 | -- |
Source: Public Records
Mortgage History
| Date | Status | Borrower | Loan Amount |
|---|---|---|---|
| Previous Owner | Heber Jean K | $99,900 |
Source: Public Records
Tax History Compared to Growth
Tax History
| Year | Tax Paid | Tax Assessment Tax Assessment Total Assessment is a certain percentage of the fair market value that is determined by local assessors to be the total taxable value of land and additions on the property. | Land | Improvement |
|---|---|---|---|---|
| 2024 | $1,847 | $12,026 | $3,400 | $8,626 |
| 2023 | $1,847 | $6,160 | $1,400 | $4,760 |
| 2022 | $1,492 | $6,160 | $1,400 | $4,760 |
| 2021 | $1,598 | $6,160 | $1,400 | $4,760 |
| 2020 | $1,473 | $7,320 | $2,400 | $4,920 |
| 2019 | $1,439 | $7,320 | $2,400 | $4,920 |
| 2018 | $3,000 | $7,320 | $2,400 | $4,920 |
| 2017 | $2,967 | $7,320 | $2,400 | $4,920 |
| 2016 | $2,923 | $7,320 | $2,400 | $4,920 |
| 2015 | $2,925 | $7,320 | $2,400 | $4,920 |
| 2014 | $1,115 | $146,600 | $0 | $0 |
| 2013 | -- | $5,860 | $0 | $0 |
Source: Public Records
Map
Nearby Homes
- 522 Dolphin Dr
- 208 Willet Dr
- 504 Dolphin Dr
- 408 Country Club Blvd
- 222 Chipping Sparrow Dr
- 100 Fairway Dr
- 109 Candlelite Path
- 108 Fairway Dr
- 102 Candlelite Path Unit 102,104,106,108
- 100 Duck Blind Ct
- 110 Harter Dr
- 0 Woodland Dr
- 403 Sunnyside Way
- 405 Sunnyside Way
- 104 Peacock Place
- 113 Tea Farm Rd
- 501 Sunnyside Way
- 107 Woodland Dr
- 208 Woodland Dr
- 105 Woodland Dr
- 210 Amberjack Way
- 214 Amberjack Way
- 208 Amberjack Way
- 248 Amberjack Way
- 100 Bonita Ct
- 100 Bonita Ct
- 213 Amberjack Way
- 265 Amberjack Way
- 211 Amberjack Way
- 206 Amberjack Way
- 102 Bonita Ct
- 209 Amberjack Way
- 301 Amberjack Way
- 204 Amberjack Way
- 101 Bonita Ct
- 104 Bonita Ct
- 303 Amberjack Way
- 110 Mackerel Ln
- 202 Amberjack Way
- 108 Mackerel Ln