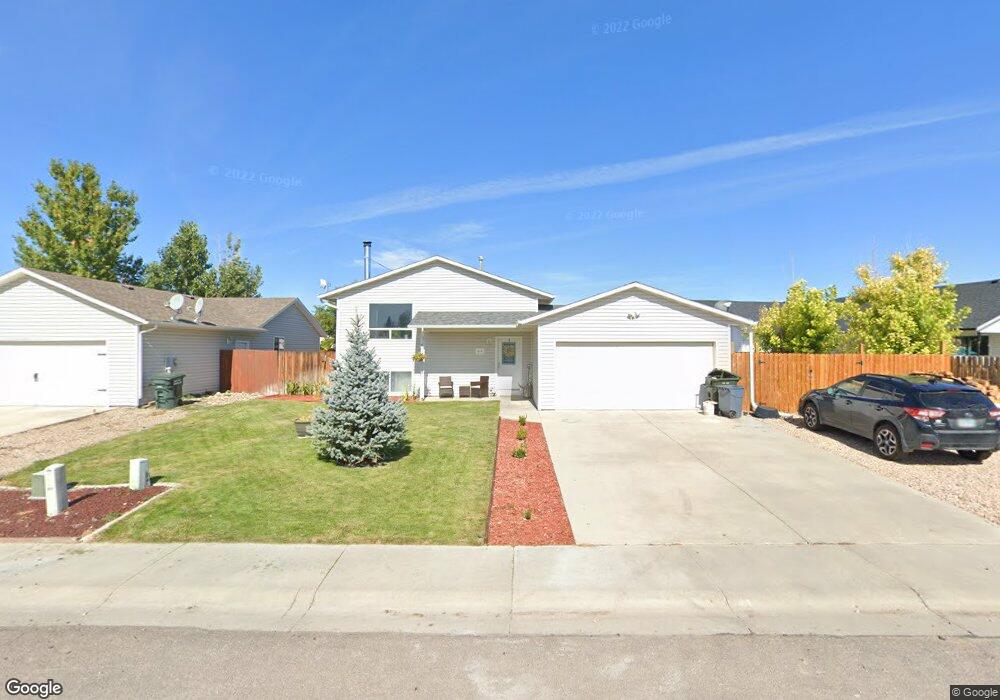
212 Bow St Unit Brownfield Douglas, WY 82633
Estimated Value: $110,000 - $353,000
3
Beds
3
Baths
2,260
Sq Ft
$121/Sq Ft
Est. Value
About This Home
This home is located at 212 Bow St Unit Brownfield, Douglas, WY 82633 and is currently estimated at $273,585, approximately $121 per square foot. 212 Bow St Unit Brownfield is a home located in Converse County with nearby schools including Douglas High School.
Ownership History
Date
Name
Owned For
Owner Type
Purchase Details
Closed on
Aug 2, 2019
Sold by
Picard Jarrad C
Bought by
Kenkel Jordan and Kenkel April
Current Estimated Value
Home Financials for this Owner
Home Financials are based on the most recent Mortgage that was taken out on this home.
Original Mortgage
$235,554
Outstanding Balance
$205,961
Interest Rate
3.62%
Mortgage Type
FHA
Estimated Equity
$67,624
Purchase Details
Closed on
Apr 22, 2016
Sold by
Breakfield Hugh Eric and Breakfield Carisa
Bought by
Picard Jerrad C
Home Financials for this Owner
Home Financials are based on the most recent Mortgage that was taken out on this home.
Original Mortgage
$166,675
Interest Rate
3.68%
Mortgage Type
New Conventional
Purchase Details
Closed on
Jan 15, 2010
Sold by
Herrera Ernie S and Herrera Cari B
Bought by
Herrera Ernie S
Purchase Details
Closed on
Feb 11, 2009
Sold by
West Plains Development Inc
Bought by
Herrera Ernie S and Herrera Cari B
Create a Home Valuation Report for This Property
The Home Valuation Report is an in-depth analysis detailing your home's value as well as a comparison with similar homes in the area
Home Values in the Area
Average Home Value in this Area
Purchase History
| Date | Buyer | Sale Price | Title Company |
|---|---|---|---|
| Kenkel Jordan | -- | None Available | |
| Picard Jerrad C | -- | First American Title | |
| Herrera Ernie S | -- | None Availabel | |
| Herrera Ernie S | -- | None Available |
Source: Public Records
Mortgage History
| Date | Status | Borrower | Loan Amount |
|---|---|---|---|
| Open | Kenkel Jordan | $235,554 | |
| Previous Owner | Picard Jerrad C | $166,675 |
Source: Public Records
Tax History Compared to Growth
Tax History
| Year | Tax Paid | Tax Assessment Tax Assessment Total Assessment is a certain percentage of the fair market value that is determined by local assessors to be the total taxable value of land and additions on the property. | Land | Improvement |
|---|---|---|---|---|
| 2025 | $1,885 | $21,041 | $3,563 | $17,478 |
| 2024 | $1,885 | $28,415 | $4,750 | $23,665 |
| 2023 | $1,689 | $30,547 | $4,152 | $26,395 |
| 2022 | $1,689 | $25,136 | $4,152 | $20,984 |
| 2021 | $1,568 | $23,057 | $4,152 | $18,905 |
| 2020 | $1,523 | $22,824 | $4,152 | $18,672 |
| 2019 | $1,525 | $22,772 | $4,152 | $18,620 |
| 2018 | $1,422 | $21,596 | $3,610 | $17,986 |
| 2017 | $1,496 | $22,682 | $4,560 | $18,122 |
| 2015 | $1,571 | $23,888 | $3,420 | $20,468 |
| 2014 | $1,407 | $21,336 | $3,420 | $17,916 |
Source: Public Records
Map
Nearby Homes
- 1039 S 5th St
- 1006 Washington St
- 816 S 7th St
- 603 S 4th St
- 0 W Richards St
- TBD W Richards St
- 605 S 8th St
- 327 S 6th St
- 475 Pearson Dr
- 728 Grant St
- 219 S 3rd St
- 1704 E Richards St
- 820 Leal St
- 1037 Bandera Ave
- 310 S Wind River Dr
- 214 La Prele Dr
- 803 Logsdon Ln
- 1144 Mesa Dr
- 401 S Ave
- 401 S Russell Lot 94 Ave