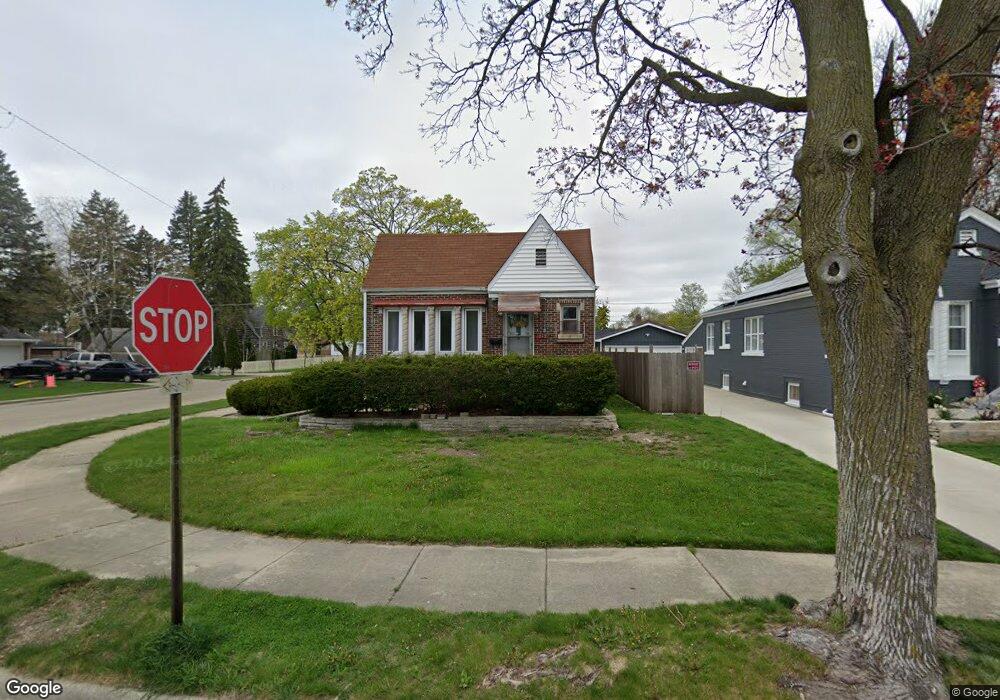
212 Burton Ave Waukegan, IL 60085
West Waukegan NeighborhoodEstimated Value: $217,791 - $230,000
2
Beds
1
Bath
1,080
Sq Ft
$208/Sq Ft
Est. Value
About This Home
This home is located at 212 Burton Ave, Waukegan, IL 60085 and is currently estimated at $224,198, approximately $207 per square foot. 212 Burton Ave is a home located in Lake County with nearby schools including Hyde Park Elementary School, Miguel Juarez Middle School, and Waukegan High School.
Ownership History
Date
Name
Owned For
Owner Type
Purchase Details
Closed on
Jan 31, 2008
Sold by
Us Bank Na
Bought by
Boettcher Eric W and Boettcher Stacy
Current Estimated Value
Home Financials for this Owner
Home Financials are based on the most recent Mortgage that was taken out on this home.
Original Mortgage
$68,000
Outstanding Balance
$41,643
Interest Rate
5.51%
Mortgage Type
Purchase Money Mortgage
Estimated Equity
$182,555
Purchase Details
Closed on
Mar 29, 2007
Sold by
Babnik
Bought by
Us Bank Na and First Franklin Mortgage Loan Trust Mortg
Purchase Details
Closed on
Feb 11, 2002
Sold by
Babnik Tony Stevens
Bought by
Babnik Tony Stevens and Babnik Monica
Purchase Details
Closed on
Jan 16, 2001
Sold by
Babnik Anton and Babnik Portia Jane
Bought by
Babnik Tony Stevens
Create a Home Valuation Report for This Property
The Home Valuation Report is an in-depth analysis detailing your home's value as well as a comparison with similar homes in the area
Home Values in the Area
Average Home Value in this Area
Purchase History
| Date | Buyer | Sale Price | Title Company |
|---|---|---|---|
| Boettcher Eric W | $85,000 | Rtc | |
| Us Bank Na | -- | None Available | |
| Babnik Tony Stevens | -- | -- | |
| Babnik Tony Stevens | -- | -- |
Source: Public Records
Mortgage History
| Date | Status | Borrower | Loan Amount |
|---|---|---|---|
| Open | Boettcher Eric W | $68,000 |
Source: Public Records
Tax History Compared to Growth
Tax History
| Year | Tax Paid | Tax Assessment Tax Assessment Total Assessment is a certain percentage of the fair market value that is determined by local assessors to be the total taxable value of land and additions on the property. | Land | Improvement |
|---|---|---|---|---|
| 2024 | $3,542 | $53,120 | $8,639 | $44,481 |
| 2023 | $3,177 | $47,559 | $7,735 | $39,824 |
| 2022 | $3,177 | $40,497 | $7,051 | $33,446 |
| 2021 | $2,853 | $35,364 | $6,641 | $28,723 |
| 2020 | $2,828 | $32,946 | $6,187 | $26,759 |
| 2019 | $2,776 | $30,189 | $5,669 | $24,520 |
| 2018 | $2,464 | $27,564 | $6,688 | $20,876 |
| 2017 | $2,331 | $24,386 | $5,917 | $18,469 |
| 2016 | $2,038 | $21,191 | $5,142 | $16,049 |
| 2015 | $1,852 | $18,966 | $4,602 | $14,364 |
| 2014 | $2,376 | $21,426 | $5,104 | $16,322 |
| 2012 | $3,238 | $23,214 | $5,531 | $17,683 |
Source: Public Records
Map
Nearby Homes
- 1416 Hamilton Ct
- 49 S Lewis Ave
- 2115 Lydia St
- 1521 Catalpa Ave
- 1213 Grand Ave
- 615 Tiffany Dr
- 23 N Jackson St
- 0 Brookside Ave
- 824 N Butrick St
- 28 N Saint James St
- 511 Chestnut St
- 1109 Massena Ave
- 428 N Poplar St
- 968 Judge Ave
- 522 N Poplar St
- 24 Washington Terrace
- 1005 N Lewis Ave
- 613 Washington St
- 702 Franklin St
- 620 N Poplar St
- 212 Burton St
- 216 Burton St
- 220 Burton St
- 1728 W Monroe St
- 227 N Elmwood Ave
- 1715 W Monroe St
- 224 Burton St
- 215 Burton St
- 231 N Elmwood Ave
- 219 N Elmwood Ave
- 208 Burton St
- 235 N Elmwood Ave
- 221 Burton St
- 302 Burton St
- 1710 W Monroe St
- 213 N Elmwood Ave
- 301 N Elmwood Ave
- 306 Burton St
- 207 Burton St
- 1708 W Monroe St