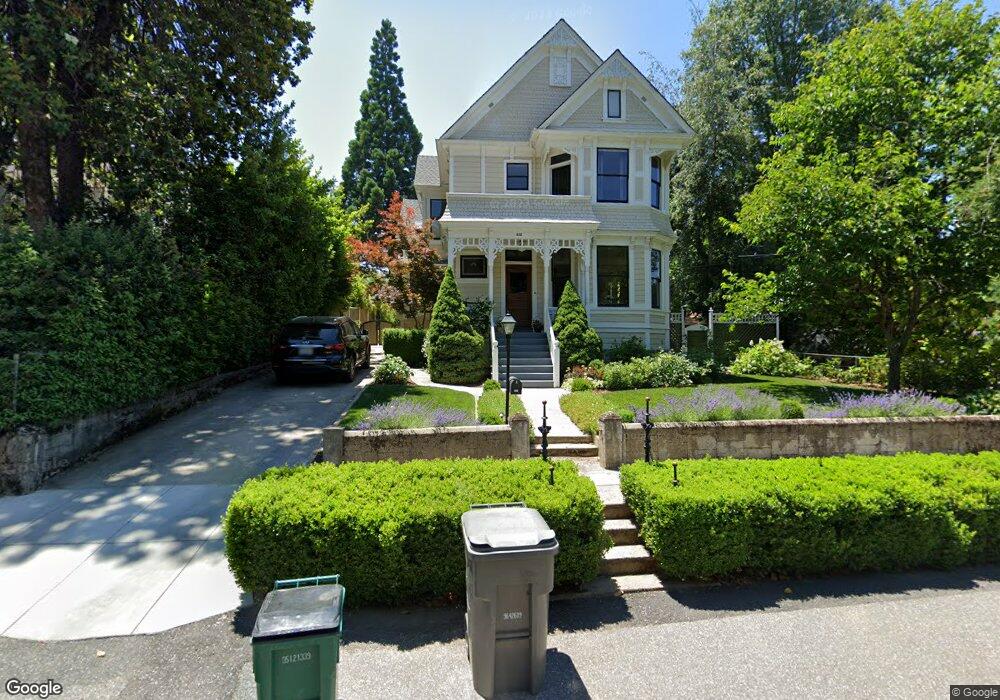
212 Clay St Nevada City, CA 95959
Estimated Value: $901,511 - $1,189,000
5
Beds
1
Bath
2,777
Sq Ft
$384/Sq Ft
Est. Value
About This Home
This home is located at 212 Clay St, Nevada City, CA 95959 and is currently estimated at $1,067,628, approximately $384 per square foot. 212 Clay St is a home located in Nevada County with nearby schools including Deer Creek Elementary School, Seven Hills Intermediate School, and Forest Charter School.
Ownership History
Date
Name
Owned For
Owner Type
Purchase Details
Closed on
Nov 10, 2016
Sold by
Fraser Brent and Fraser Julie C
Bought by
Fraser Brent P and Fraser Julie C
Current Estimated Value
Purchase Details
Closed on
May 19, 2006
Sold by
Lazard Alain J and Lazard Sarah M
Bought by
Fraser Brent and Fraser Julie C
Home Financials for this Owner
Home Financials are based on the most recent Mortgage that was taken out on this home.
Original Mortgage
$417,000
Outstanding Balance
$242,336
Interest Rate
6.46%
Mortgage Type
Fannie Mae Freddie Mac
Estimated Equity
$825,292
Create a Home Valuation Report for This Property
The Home Valuation Report is an in-depth analysis detailing your home's value as well as a comparison with similar homes in the area
Home Values in the Area
Average Home Value in this Area
Purchase History
| Date | Buyer | Sale Price | Title Company |
|---|---|---|---|
| Fraser Brent P | -- | None Available | |
| Fraser Brent | -- | Placer Title Company |
Source: Public Records
Mortgage History
| Date | Status | Borrower | Loan Amount |
|---|---|---|---|
| Open | Fraser Brent | $417,000 |
Source: Public Records
Tax History
| Year | Tax Paid | Tax Assessment Tax Assessment Total Assessment is a certain percentage of the fair market value that is determined by local assessors to be the total taxable value of land and additions on the property. | Land | Improvement |
|---|---|---|---|---|
| 2025 | $11,489 | $1,100,000 | $300,000 | $800,000 |
| 2024 | $11,502 | $1,100,000 | $300,000 | $800,000 |
| 2023 | $11,502 | $1,100,000 | $300,000 | $800,000 |
| 2022 | $12,850 | $1,111,200 | $344,000 | $767,200 |
| 2021 | $10,044 | $966,200 | $299,100 | $667,100 |
| 2020 | $8,573 | $817,600 | $260,100 | $557,500 |
| 2019 | $8,400 | $801,600 | $255,000 | $546,600 |
| 2018 | $0 | $785,900 | $250,000 | $535,900 |
| 2017 | $7,456 | $711,000 | $232,000 | $479,000 |
| 2016 | $6,654 | $646,000 | $211,000 | $435,000 |
| 2015 | $6,341 | $615,000 | $201,000 | $414,000 |
| 2014 | $6,183 | $597,000 | $195,000 | $402,000 |
Source: Public Records
Map
Nearby Homes
Your Personal Tour Guide
Ask me questions while you tour the home.