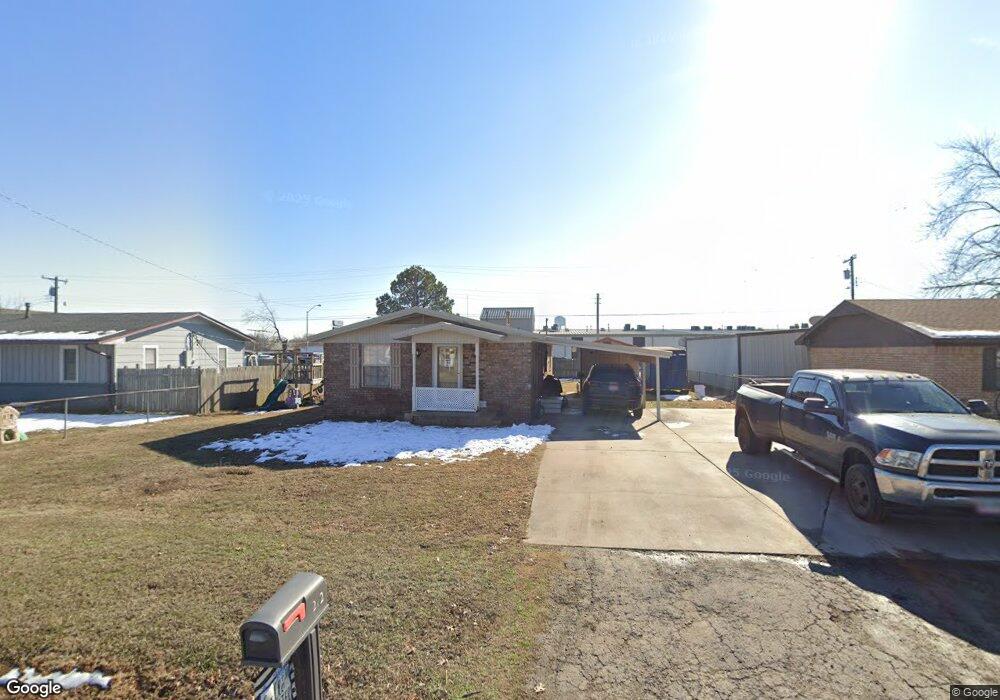
212 Duncan Ave Checotah, OK 74426
Estimated Value: $112,000 - $153,000
3
Beds
1
Bath
1,056
Sq Ft
$123/Sq Ft
Est. Value
About This Home
This home is located at 212 Duncan Ave, Checotah, OK 74426 and is currently estimated at $130,023, approximately $123 per square foot. 212 Duncan Ave is a home located in McIntosh County with nearby schools including Marshall Elementary School, Checotah Intermediate Elementary School, and Checotah Middle School.
Ownership History
Date
Name
Owned For
Owner Type
Purchase Details
Closed on
Apr 27, 2015
Sold by
Mann Rick and Mann Neoma
Bought by
Frazier Jamie
Current Estimated Value
Home Financials for this Owner
Home Financials are based on the most recent Mortgage that was taken out on this home.
Original Mortgage
$72,000
Outstanding Balance
$27,031
Interest Rate
3.89%
Mortgage Type
Future Advance Clause Open End Mortgage
Estimated Equity
$102,992
Purchase Details
Closed on
Feb 9, 2012
Sold by
Johnson Anthony and Johnson Debra
Bought by
Mann Rick and Mann Neoma
Home Financials for this Owner
Home Financials are based on the most recent Mortgage that was taken out on this home.
Original Mortgage
$40,323
Interest Rate
4%
Mortgage Type
Future Advance Clause Open End Mortgage
Purchase Details
Closed on
Nov 25, 1997
Sold by
Lancaster
Bought by
Johnson
Purchase Details
Closed on
Mar 16, 1996
Sold by
Helton
Bought by
Lancaster
Create a Home Valuation Report for This Property
The Home Valuation Report is an in-depth analysis detailing your home's value as well as a comparison with similar homes in the area
Home Values in the Area
Average Home Value in this Area
Purchase History
| Date | Buyer | Sale Price | Title Company |
|---|---|---|---|
| Frazier Jamie | $80,000 | None Available | |
| Mann Rick | $29,500 | None Available | |
| Johnson | $43,000 | -- | |
| Lancaster | $35,000 | -- |
Source: Public Records
Mortgage History
| Date | Status | Borrower | Loan Amount |
|---|---|---|---|
| Open | Frazier Jamie | $72,000 | |
| Previous Owner | Mann Rick | $40,323 |
Source: Public Records
Tax History Compared to Growth
Tax History
| Year | Tax Paid | Tax Assessment Tax Assessment Total Assessment is a certain percentage of the fair market value that is determined by local assessors to be the total taxable value of land and additions on the property. | Land | Improvement |
|---|---|---|---|---|
| 2024 | $804 | $9,620 | $529 | $9,091 |
| 2023 | $804 | $8,884 | $529 | $8,355 |
| 2022 | $728 | $8,461 | $529 | $7,932 |
| 2021 | $797 | $8,406 | $529 | $7,877 |
| 2020 | $870 | $9,046 | $529 | $8,517 |
| 2019 | $864 | $9,046 | $529 | $8,517 |
| 2018 | $858 | $9,047 | $529 | $8,518 |
| 2017 | $852 | $9,047 | $529 | $8,518 |
| 2016 | $854 | $8,854 | $529 | $8,325 |
| 2015 | $690 | $7,154 | $529 | $6,625 |
| 2014 | $532 | $5,528 | $529 | $4,999 |
Source: Public Records
Map
Nearby Homes
- 504 SW 1st St
- 514 SE Main St
- 410 SW 3rd St
- 1045 W Mcintosh Ave
- 1130 White Stag Ave
- 0 SE Main St
- 508 Kimberly Dr
- 220 E Audd Ave
- 310 E Audd Ave
- 0 Paul Carr Dr Unit 2524865
- 0 S 4202 Rd Unit 2518287
- 112580 New Texanna Rd
- 513 N Wineblood St
- 605 N Wineblood St
- 613 N Wineblood St
- 737 NW 4th St
- 705 NW 8th St
- 0 W North Ave
- 825 NW 8th St
- 424398 Texanna Rd
- 214 Duncan Ave
- 210 Duncan Ave
- 216 Duncan Ave
- 208 Duncan Ave
- 213 Duncan Ave
- 215 Duncan Ave
- 209 Duncan Ave
- 218 Duncan Ave
- 217 Duncan Ave
- 207 Duncan Ave
- 204 Duncan Ave
- 219 Duncan Ave
- 212 Miles Ave
- 210 Miles Ave
- 216 Miles Ave
- 107208 Council Tree Dr
- 102613 S 4240 Rd
- 221 Duncan Ave
- 208 Miles Ave
- 222 Duncan Ave