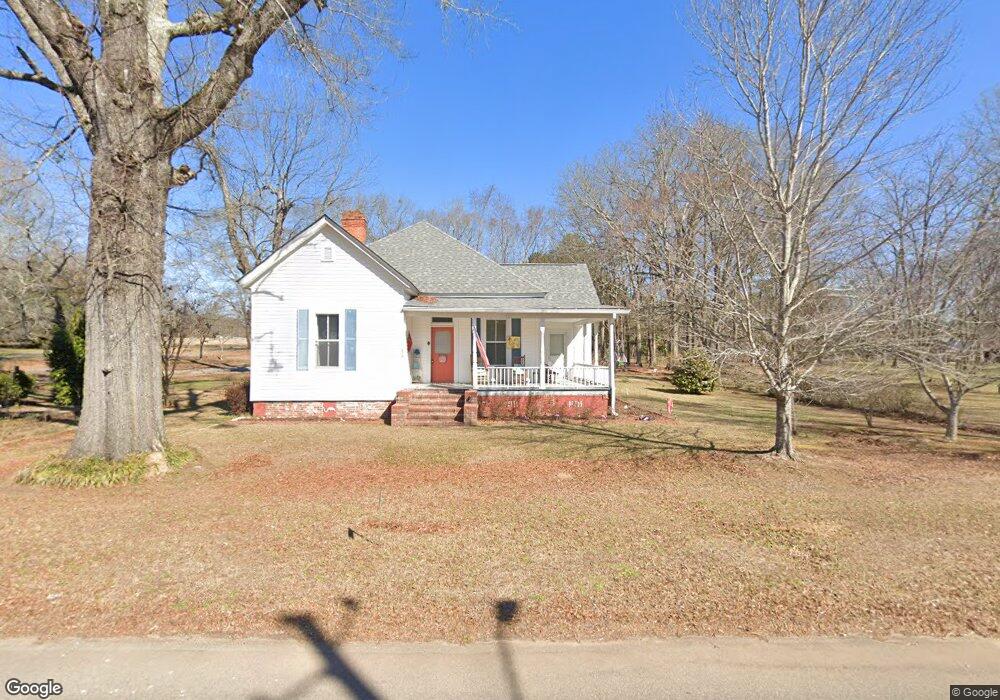
212 E Main St Rutledge, GA 30663
Estimated Value: $250,476 - $382,000
Studio
1
Bath
2,059
Sq Ft
$161/Sq Ft
Est. Value
About This Home
This home is located at 212 E Main St, Rutledge, GA 30663 and is currently estimated at $330,869, approximately $160 per square foot. 212 E Main St is a home located in Morgan County with nearby schools including Morgan County Primary School, Morgan County Elementary School, and Morgan County Middle School.
Ownership History
Date
Name
Owned For
Owner Type
Purchase Details
Closed on
Feb 9, 1978
Sold by
Jones Morgan L
Bought by
Thompson Brenda K Bishop
Current Estimated Value
Purchase Details
Closed on
Jul 28, 1972
Sold by
Jones M B
Bought by
Jones Morgan L
Purchase Details
Closed on
Aug 23, 1945
Sold by
Ozburn Joel
Bought by
Jones M B
Purchase Details
Closed on
Jan 8, 1937
Sold by
Davis W H
Bought by
Ozburn Joel
Purchase Details
Closed on
Oct 20, 1930
Sold by
Saye S R
Bought by
Davis W H
Create a Home Valuation Report for This Property
The Home Valuation Report is an in-depth analysis detailing your home's value as well as a comparison with similar homes in the area
Home Values in the Area
Average Home Value in this Area
Purchase History
| Date | Buyer | Sale Price | Title Company |
|---|---|---|---|
| Thompson Brenda K Bishop | $15,000 | -- | |
| Jones Morgan L | -- | -- | |
| Jones M B | -- | -- | |
| Ozburn Joel | -- | -- | |
| Davis W H | -- | -- |
Source: Public Records
Tax History
| Year | Tax Paid | Tax Assessment Tax Assessment Total Assessment is a certain percentage of the fair market value that is determined by local assessors to be the total taxable value of land and additions on the property. | Land | Improvement |
|---|---|---|---|---|
| 2025 | $1,728 | $99,742 | $13,600 | $86,142 |
| 2024 | $1,756 | $84,622 | $13,600 | $71,022 |
| 2023 | $1,579 | $75,935 | $12,000 | $63,935 |
| 2022 | $1,558 | $72,890 | $12,000 | $60,890 |
| 2021 | $1,378 | $66,168 | $8,000 | $58,168 |
| 2020 | $1,336 | $64,168 | $6,000 | $58,168 |
| 2019 | $1,356 | $64,168 | $6,000 | $58,168 |
| 2018 | $1,287 | $61,120 | $6,000 | $55,120 |
| 2017 | $1,724 | $58,829 | $6,000 | $52,829 |
| 2016 | $1,038 | $51,046 | $6,000 | $45,046 |
| 2015 | $1,042 | $49,520 | $4,000 | $45,520 |
| 2014 | $696 | $38,996 | $4,000 | $34,996 |
| 2013 | -- | $31,400 | $4,000 | $27,400 |
Source: Public Records
Map
Nearby Homes
- 234 E Main St
- 178 Fairplay St
- 170 Fairplay St
- 224 Hollis St
- 120 Hidden Falls Ct
- 294 Tuscany Dr
- 0 Hawkins Academy Rd Unit 10561655
- 305 Fairplay St
- 1051 Lake Rutledge Rd
- 542 Indian Creek Trail
- 4610 Atlanta Hwy
- 5761 W Dixie Hwy
- 0 W Dixie Hwy Unit 10499573
- 5521 Atlanta Hwy
- 1041 Cooper Ln
- 2791 Old Mill Rd
- 1150 Harris Hollis Ln
- 5841 Atlanta Hwy
- 3320 Davis Academy Rd
- 3195 Davis Academy Rd
- 192 E Main St
- 250 E Main St
- 217 James St
- 223 James St
- 195 E Dixie Hwy
- 185 E Dixie Hwy
- 185 E Dixie Hwy
- 183 E Dixie Hwy Unit S A & B
- 183 E Dixie Hwy
- 215 E Dixie Hwy
- 176 E Main St
- 231 James St
- 175 E Main St
- 175 E Main St Unit A
- 175 E Main St Unit B
- 225 James St
- 233 James St Unit B
- 233 James St Unit A
- 164 E Main St
- 237 James St
Your Personal Tour Guide
Ask me questions while you tour the home.