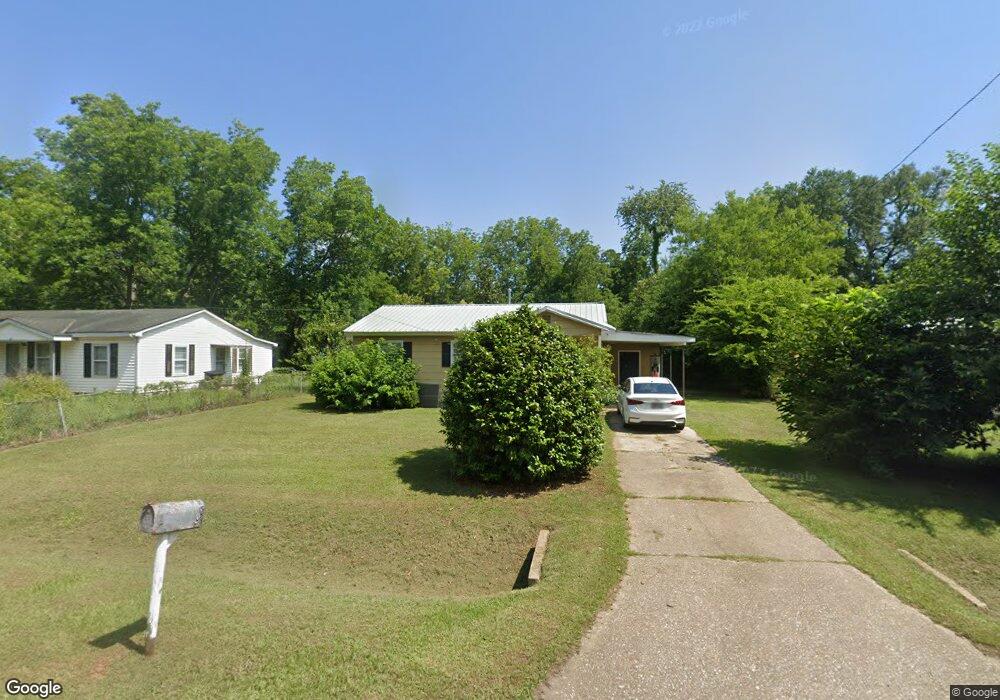
212 Edward Dr Albany, GA 31705
Radium Springs NeighborhoodEstimated Value: $58,202 - $119,000
2
Beds
1
Bath
792
Sq Ft
$105/Sq Ft
Est. Value
About This Home
This home is located at 212 Edward Dr, Albany, GA 31705 and is currently estimated at $83,551, approximately $105 per square foot. 212 Edward Dr is a home located in Dougherty County with nearby schools including Morningside Elementary School, Southside Middle School, and Monroe High School.
Ownership History
Date
Name
Owned For
Owner Type
Purchase Details
Closed on
Jan 20, 2022
Sold by
Burrell Lynn Stewart
Bought by
Payne Properties Llc
Current Estimated Value
Home Financials for this Owner
Home Financials are based on the most recent Mortgage that was taken out on this home.
Original Mortgage
$412,000
Interest Rate
3.45%
Mortgage Type
Mortgage Modification
Purchase Details
Closed on
Jul 2, 2021
Sold by
Smith Ethan D
Bought by
Burrell Lynn S
Purchase Details
Closed on
Aug 1, 2019
Sold by
Burrell Lynn Stewart
Bought by
Smith Ethan D
Home Financials for this Owner
Home Financials are based on the most recent Mortgage that was taken out on this home.
Original Mortgage
$361,210
Interest Rate
3.7%
Mortgage Type
New Conventional
Purchase Details
Closed on
Aug 9, 2007
Sold by
Dollar Wm C and Dollar Jennie
Bought by
Burrell Lynn Stewart
Purchase Details
Closed on
Mar 11, 1969
Sold by
Harrison Edwin J
Bought by
Dollar Wm and Dollar C
Create a Home Valuation Report for This Property
The Home Valuation Report is an in-depth analysis detailing your home's value as well as a comparison with similar homes in the area
Home Values in the Area
Average Home Value in this Area
Purchase History
| Date | Buyer | Sale Price | Title Company |
|---|---|---|---|
| Payne Properties Llc | $75,000 | -- | |
| Burrell Lynn S | -- | -- | |
| Smith Ethan D | $365,460 | -- | |
| Burrell Lynn Stewart | $26,500 | -- | |
| Dollar Wm | -- | -- |
Source: Public Records
Mortgage History
| Date | Status | Borrower | Loan Amount |
|---|---|---|---|
| Closed | Payne Properties Llc | $412,000 | |
| Previous Owner | Smith Ethan D | $361,210 | |
| Closed | Burrell Lynn Stewart | $0 |
Source: Public Records
Tax History Compared to Growth
Tax History
| Year | Tax Paid | Tax Assessment Tax Assessment Total Assessment is a certain percentage of the fair market value that is determined by local assessors to be the total taxable value of land and additions on the property. | Land | Improvement |
|---|---|---|---|---|
| 2024 | $609 | $12,760 | $1,840 | $10,920 |
| 2023 | $335 | $12,760 | $1,840 | $10,920 |
| 2022 | $597 | $12,760 | $1,840 | $10,920 |
| 2021 | $553 | $12,760 | $1,840 | $10,920 |
| 2020 | $445 | $12,760 | $1,840 | $10,920 |
| 2019 | $557 | $12,760 | $1,840 | $10,920 |
| 2018 | $559 | $12,760 | $1,840 | $10,920 |
| 2017 | $521 | $12,760 | $1,840 | $10,920 |
| 2016 | $521 | $12,760 | $1,840 | $10,920 |
| 2015 | $522 | $12,760 | $1,840 | $10,920 |
| 2014 | $516 | $12,760 | $1,840 | $10,920 |
Source: Public Records
Map
Nearby Homes
- 211 Cannon Ave
- 403 Farkas Ln
- 113 Morningside Dr
- 111 Morningside Dr
- 1304 Mobile Ave
- 1102 Van Deman St
- 1013 Crawford Dr
- 1011 Crawford Dr
- 939 Crawford Dr
- 206 Raintree Dr
- 916 Crawford Dr
- 925 Mercedes St
- 502 Mitchell Ave
- 911 Mercedes St
- 401 Mitchell Ave
- 410 Redbud Rd
- 454 Poinciana Ave
- 2421 Cherry Laurel Ln
- 2220 S Jackson St
- 2601 S Jackson St
- 214 Edward Dr
- 210 Edward Dr
- 216 Edward Dr
- 208 Edward Dr
- 213 Whitehead Dr
- 211 Whitehead Dr
- 215 Whitehead Dr
- 217 Whitehead Dr
- 209 Whitehead Dr
- 213 Edward Dr
- 218 Edward Dr
- 206 Edward Dr
- 215 Edward Dr
- 211 Edward Dr
- 217 Edward Dr
- 209 Edward Dr
- 219 Whitehead Dr
- 220 Edward Dr
- 204 Edward Dr
- 207 Whitehead Dr