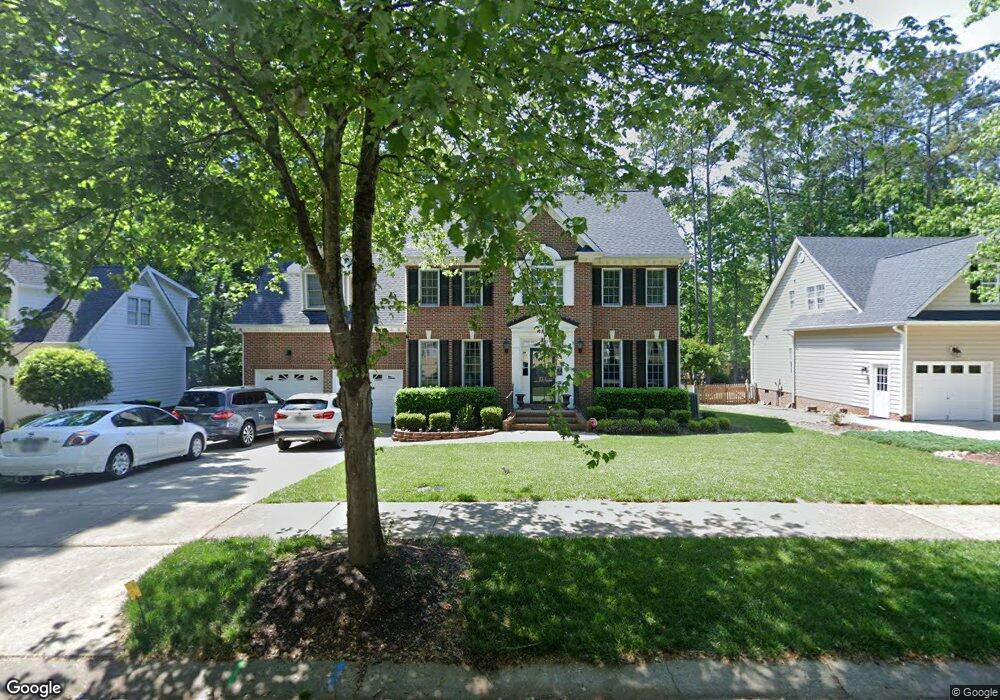
212 Flatrock Ln Holly Springs, NC 27540
Estimated Value: $658,000 - $747,000
4
Beds
4
Baths
2,773
Sq Ft
$250/Sq Ft
Est. Value
About This Home
This home is located at 212 Flatrock Ln, Holly Springs, NC 27540 and is currently estimated at $692,682, approximately $249 per square foot. 212 Flatrock Ln is a home located in Wake County with nearby schools including Holly Ridge Elementary School, Holly Ridge Middle School, and Holly Springs High School.
Ownership History
Date
Name
Owned For
Owner Type
Purchase Details
Closed on
May 28, 2014
Sold by
Bryan David N and Bryan Melissa M
Bought by
Tanjong Atemako T and Tanjong Amy L
Current Estimated Value
Home Financials for this Owner
Home Financials are based on the most recent Mortgage that was taken out on this home.
Original Mortgage
$270,400
Outstanding Balance
$206,597
Interest Rate
4.32%
Mortgage Type
New Conventional
Estimated Equity
$486,085
Purchase Details
Closed on
Dec 5, 2001
Sold by
Hetzel Timothy M and Hetzel Kristin
Bought by
Bryan David N and Bryan Melissa M
Home Financials for this Owner
Home Financials are based on the most recent Mortgage that was taken out on this home.
Original Mortgage
$186,800
Interest Rate
6.81%
Purchase Details
Closed on
Jan 12, 1999
Sold by
Upright Builders Inc
Bought by
Hetzel Timothy M and Hetzel Kristin
Home Financials for this Owner
Home Financials are based on the most recent Mortgage that was taken out on this home.
Original Mortgage
$175,000
Interest Rate
6.77%
Create a Home Valuation Report for This Property
The Home Valuation Report is an in-depth analysis detailing your home's value as well as a comparison with similar homes in the area
Home Values in the Area
Average Home Value in this Area
Purchase History
| Date | Buyer | Sale Price | Title Company |
|---|---|---|---|
| Tanjong Atemako T | $338,000 | None Available | |
| Bryan David N | $233,500 | -- | |
| Hetzel Timothy M | $225,000 | -- |
Source: Public Records
Mortgage History
| Date | Status | Borrower | Loan Amount |
|---|---|---|---|
| Open | Tanjong Atemako T | $270,400 | |
| Previous Owner | Bryan David N | $186,800 | |
| Previous Owner | Hetzel Timothy M | $175,000 |
Source: Public Records
Tax History Compared to Growth
Tax History
| Year | Tax Paid | Tax Assessment Tax Assessment Total Assessment is a certain percentage of the fair market value that is determined by local assessors to be the total taxable value of land and additions on the property. | Land | Improvement |
|---|---|---|---|---|
| 2025 | $5,368 | $621,465 | $145,000 | $476,465 |
| 2024 | $5,346 | $621,465 | $145,000 | $476,465 |
| 2023 | $4,227 | $390,018 | $75,000 | $315,018 |
| 2022 | $4,080 | $390,018 | $75,000 | $315,018 |
| 2021 | $4,004 | $390,018 | $75,000 | $315,018 |
| 2020 | $4,004 | $390,018 | $75,000 | $315,018 |
| 2019 | $4,125 | $341,206 | $80,000 | $261,206 |
| 2018 | $3,729 | $341,206 | $80,000 | $261,206 |
| 2017 | $3,594 | $341,206 | $80,000 | $261,206 |
| 2016 | $3,423 | $329,467 | $80,000 | $249,467 |
| 2015 | $3,244 | $307,237 | $64,000 | $243,237 |
| 2014 | $3,132 | $307,237 | $64,000 | $243,237 |
Source: Public Records
Map
Nearby Homes
- 0/416 Holly Springs Rd
- 109 Lacombe Ct
- 5200 Gable Ridge Ln
- 225 Old Ride Dr
- 504 Prince Dr
- 208 Old Ride Dr
- 404 Prince Dr
- 217 Jones Hill Rd
- 228 Masden Rd
- 413 Rhamkatte Rd
- 0 Old Ride Dr
- 705 Morton Farm Rd
- 215 Savannah Ridge Rd Unit 215
- 112 Midden Way
- 305 Savannah Ridge Rd
- 717 Bass Lake Rd
- 116 Cabrita Ct
- 4809 Greenpoint Ln
- 204 Crossway Ln
- 204 Chrismill Ln
- 216 Flatrock Ln
- 208 Flatrock Ln
- 109 Norwalk St
- 204 Flatrock Ln
- 220 Flatrock Ln
- 113 Norwalk St
- 105 Norwalk St
- 213 Flatrock Ln
- 217 Flatrock Ln
- 101 Norwalk St
- 117 Norwalk St
- 209 Flatrock Ln
- 221 Flatrock Ln
- 205 Flatrock Ln
- 225 Flatrock Ln
- 309 Holly Park Dr
- 313 Holly Park Dr
- 305 Holly Park Dr
- 101 Flatrock Ln
- 201 Flatrock Ln