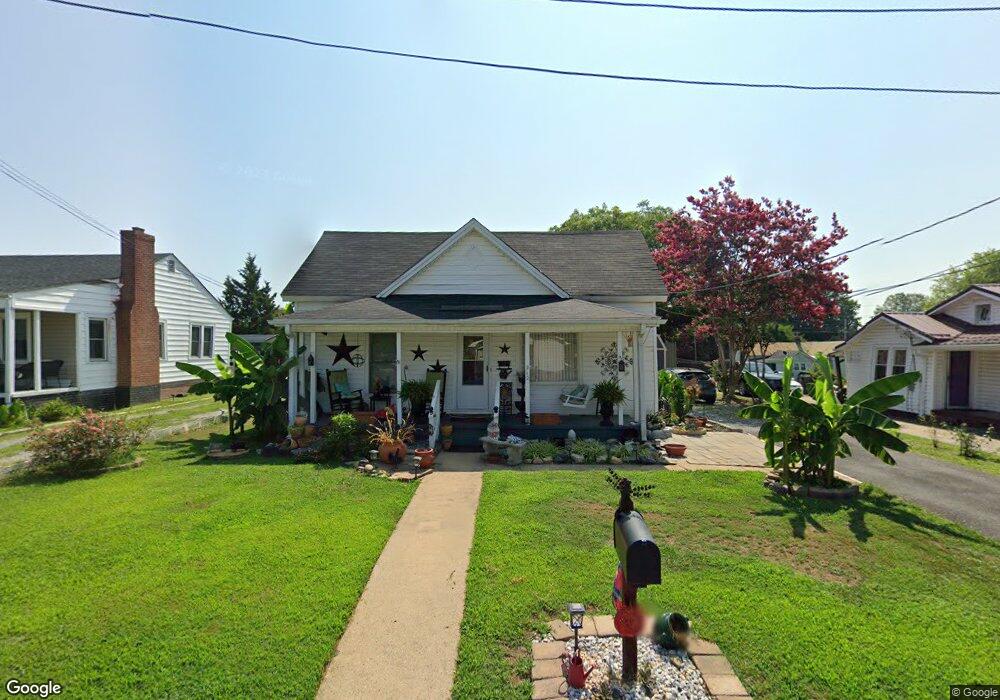
212 Foy Ave Lexington, NC 27292
Estimated Value: $75,000 - $139,000
2
Beds
1
Bath
1,190
Sq Ft
$82/Sq Ft
Est. Value
About This Home
This home is located at 212 Foy Ave, Lexington, NC 27292 and is currently estimated at $97,921, approximately $82 per square foot. 212 Foy Ave is a home located in Davidson County with nearby schools including South Lexington School, Lexington Middle School, and Lexington Senior High School.
Ownership History
Date
Name
Owned For
Owner Type
Purchase Details
Closed on
Dec 4, 2020
Sold by
Varron Patricia Bean and Bean Patricia J
Bought by
Mascoro Carlos Cueto and Flores Gloria P
Current Estimated Value
Home Financials for this Owner
Home Financials are based on the most recent Mortgage that was taken out on this home.
Original Mortgage
$40,000
Outstanding Balance
$25,632
Interest Rate
2.8%
Mortgage Type
Seller Take Back
Estimated Equity
$72,289
Purchase Details
Closed on
Aug 1, 1980
Create a Home Valuation Report for This Property
The Home Valuation Report is an in-depth analysis detailing your home's value as well as a comparison with similar homes in the area
Home Values in the Area
Average Home Value in this Area
Purchase History
| Date | Buyer | Sale Price | Title Company |
|---|---|---|---|
| Mascoro Carlos Cueto | $45,000 | Chicago Title Insurance Co | |
| -- | $10,000 | -- |
Source: Public Records
Mortgage History
| Date | Status | Borrower | Loan Amount |
|---|---|---|---|
| Open | Mascoro Carlos Cueto | $40,000 |
Source: Public Records
Tax History Compared to Growth
Tax History
| Year | Tax Paid | Tax Assessment Tax Assessment Total Assessment is a certain percentage of the fair market value that is determined by local assessors to be the total taxable value of land and additions on the property. | Land | Improvement |
|---|---|---|---|---|
| 2025 | $707 | $54,360 | $0 | $0 |
| 2024 | $707 | $54,360 | $0 | $0 |
| 2023 | $707 | $54,360 | $0 | $0 |
| 2022 | $707 | $54,360 | $0 | $0 |
| 2021 | $707 | $54,360 | $0 | $0 |
| 2020 | $566 | $43,840 | $0 | $0 |
| 2019 | $574 | $43,840 | $0 | $0 |
| 2018 | $574 | $43,840 | $0 | $0 |
| 2017 | $574 | $43,840 | $0 | $0 |
| 2016 | $574 | $43,840 | $0 | $0 |
| 2015 | $552 | $43,840 | $0 | $0 |
| 2014 | $617 | $48,980 | $0 | $0 |
Source: Public Records
Map
Nearby Homes